Is there an activity monitor for VS Code and VS Code extensions? [duplicate]
Asked Answered
A

2

5

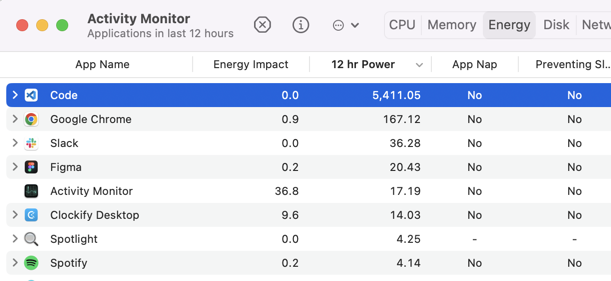
The other day I was using my laptop unplugged and it went from fully charged to 10% in 3 hours. Normally the battery would last all day. Long story short VS Code was obliterating my battery life. VS Code's energy usage appears to be almost 30 times higher than Chrome, the #2 energy user. I'm not doing anything crazy – just some Shopify and Laravel templating – but I'm assuming it's because of some of my extensions, not VS Code itself.

enter image description here

Does anyone know of a way to show CPU usage per extension? I looked around but didn't find anything. Or is there some other way I can track down the culprit? I think CPU usage over a long period of time (like a few hours) would be more useful than current usage.

Actinology answered 1/7, 2023 at 0:39 Comment(5)
Open "Help" then "Open Process Explorer". This shows all current processes, it should show which extension is taking so much CPU.Slipstream
@LightningMcQueen Which extensions get there own PID, they all run in the extensionHostLucho
VSC does some monitoring of extensions. If I have a very large file one of my extensions take quit some time to search it and VSC reports it that extensionXYZ takes 98% of the time to execute eventPQR, in the Developer Tools ConsoleLucho
@Lucho That's true, but on any process under extensionHost right-click then "copy" might give a hint about which extension is taking such a huge part of CPU.Slipstream
Thanks to both of you for the tips! Ended up finding the culprit with htop before I saw your comments. Looks like VSC's Process Explorer would've shown me the same thing.Actinology
W
10

VS Code has a process explorer, which you can open with the Developer: Open Process Explorer command in the command palette. You can find extension-related processes under the "extensionHost" tree item. Not every active extension will be shown there since this is just for extensions that run their own child processes, and it's only showing those child processes. It'll show CPU and memory usage.

You can get similar information from using other system tools like an Activity Monitor / Process Manager tool, or htop.

Note that VS Code is built on Chromium, so you can also use Chromium's profiling tools. Open the devtools with the Developer: Toggle Developer Tools command in the command palette, and got the "Performance" tab, where you can capture performance traces. There's also the overall "Performance monitor" view (open the devtools console and click the three dot menu to find it).

If VS Code is consuming a lot of CPU, see also https://github.com/microsoft/vscode/wiki/Performance-Issues#consuming-cpu.

Whittaker answered 1/7, 2023 at 3:58 Comment(0)
A
0

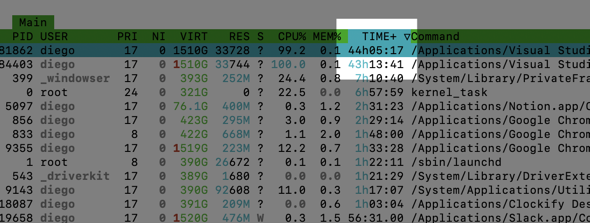
Found the culprit with htop. As pointed out in the comments, VS Code also has a Process Explorer that would've shown similar info. One nice thing about htop is that it shows CPU Time, which was helpful in finding processes with high CPU usage over a period of time.

enter image description here

Actinology answered 1/7, 2023 at 2:12 Comment(2)
what was the type of extension? Was it a Language Server?Lucho
@Lucho it was this: marketplace.visualstudio.com/…. But I quit the processes, restarted VS Code, and the problem hasn't come back. So I guess that's not normal behavior for that extension.Actinology

© 2022 - 2024 — McMap. All rights reserved.