thresholds in roc_curve in scikit learn
Asked Answered
W

2

16

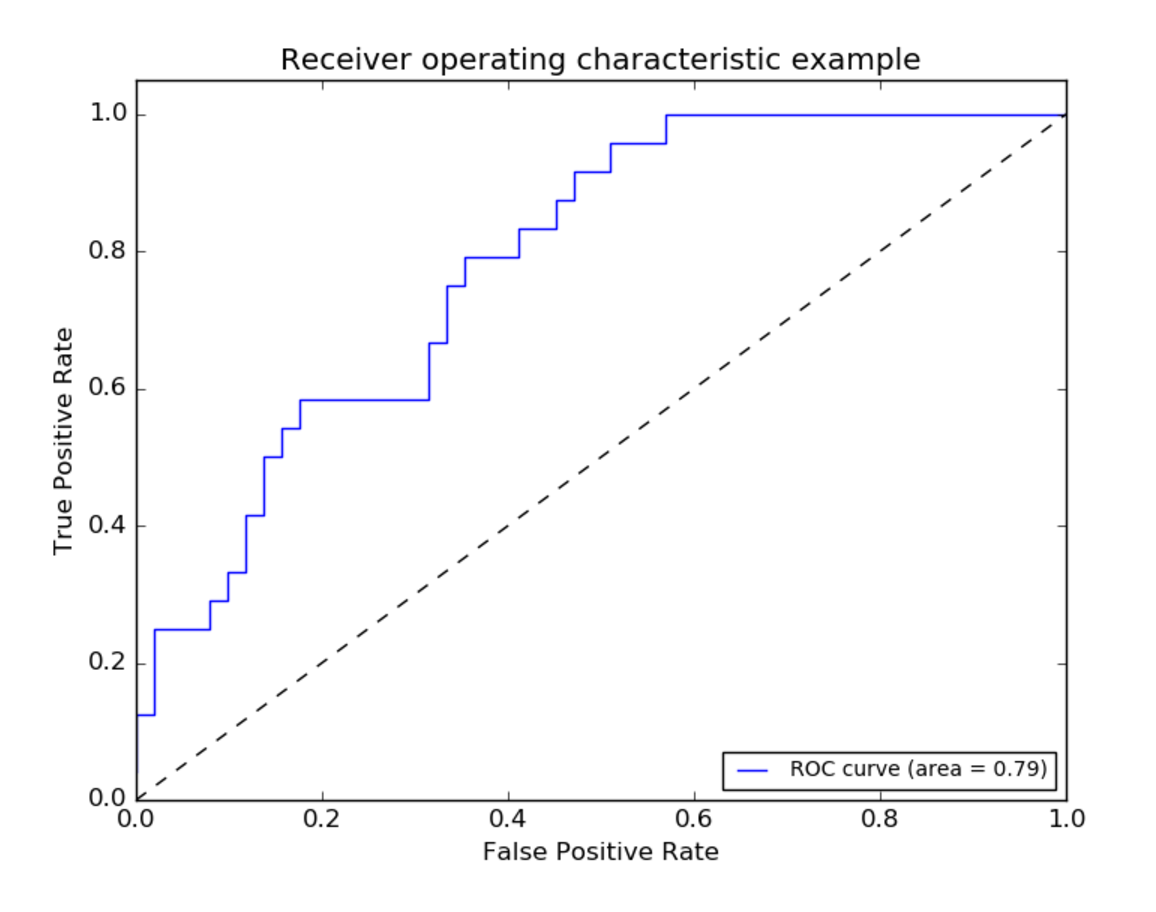
I am referring to the below link and sample, and post the plot diagram from this page where I am confused. My confusion is, there are only 4 threshold, but it seems the roc curve has many data points (> 4 data points), wondering how roc_curve working underlying to find more data points?

http://scikit-learn.org/stable/modules/model_evaluation.html#roc-metrics

>>> import numpy as np
>>> from sklearn.metrics import roc_curve
>>> y = np.array([1, 1, 2, 2])
>>> scores = np.array([0.1, 0.4, 0.35, 0.8])
>>> fpr, tpr, thresholds = roc_curve(y, scores, pos_label=2)
>>> fpr
array([ 0. ,  0.5,  0.5,  1. ])
>>> tpr
array([ 0.5,  0.5,  1. ,  1. ])
>>> thresholds
array([ 0.8 ,  0.4 ,  0.35,  0.1 ])

enter image description here

Wainscot answered 25/8, 2016 at 22:47 Comment(0)
O
6

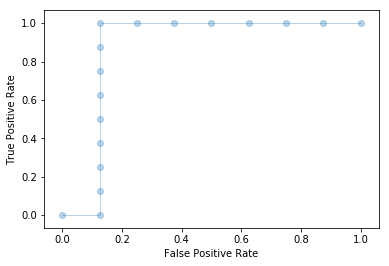
As HaohanWang mentioned, the parameter 'drop_intermediate' in function roc_curve can drop some suboptimal thresholds for creating lighter ROC curves. (roc_curve).

If set the parameter to be False, all threshold will be displayed, for example: enter image description here

all thresholds and corresponding TPRs and FPRs are calculated, but some of them are useless for plotting the ROC curve.

Orville answered 18/4, 2019 at 1:29 Comment(2)
What is considered a sub optimal threshold?Robeson
@Robeson a suboptimal threshold corresponds to a point on the ROC curve that is colinear with adjacent points. For example, look at all the thresholds at TPR=1. They don't add anything to the ROC curve, so its simpler to interpolate between them. See the source code for more details: github.com/scikit-learn/scikit-learn/blob/…Sevenfold
B
1

That plot is actually from this example: http://scikit-learn.org/stable/auto_examples/model_selection/plot_roc.html

Berget answered 26/8, 2016 at 3:15 Comment(6)
I see, thanks maxymoo. I have a general question, when we use roc_curve in scikit learn, I think in order to draw ROC curve, we need to select model threshold, and which reflects to related FPR and FNR. Wondering how scikie learn roc_curve choose threshold?Wainscot
BTW, maxymoo, in your example, I think in order to draw roc_curve, scikit learn also need model performance of TPR and FNR for a lot of model threshold, correct? But in your example, I do not need they train model with different threshold. If you could clarify a bit more, it will be great. :)Wainscot
I think the thresholds are just the distinct values of scoreBerget
Thanks maxymoo, if you could elaborate a bit more, it will be great. I am confused by this line of code fpr[i], tpr[i], _ = roc_curve(y_test[:, i], y_score[:, i]), y_test[:, i] is the real result for classification, and y_score[:, i] is the prediction results => In the sample you mentioned (scikit-learn.org/stable/auto_examples/model_selection/…). For score, I think you mean predicted results? Which is y_score[:, i], I just curious how discrete value (I think it is class label predicted results, like 0 and 1) from y_score[:, i]Wainscot
(cont'd) to draw roc? I think roc needs tpr and fpr according to different model threshold, but in this example, model only score/trained once. If I mis-understand anything, please feel free to correct me. Thanks.Wainscot
see drop_intermediate argument of the roc_curve method. (scikit-learn.org/stable/modules/generated/…). Basically, sometimes, sklearn decides to drop some non-useful thresholds, resulting in thresholds to be less than distinct values. @LinMaMagritte

© 2022 - 2024 — McMap. All rights reserved.