Attach visual studio debugger to electron app
Asked Answered
L

3

16

I'm attempting to debug electron app from visual studio 2017 (and not vscode) from scratch.

I created a console nodejs project, install and save electron. Project structure: enter image description here
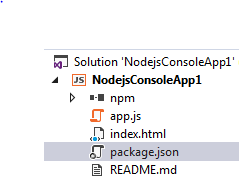
Content of app.js (taken from website of electron):

'use strict';

const { app, BrowserWindow } = require('electron')
const path = require('path')
const url = require('url')

// Keep a global reference of the window object, if you don't, the window will
// be closed automatically when the JavaScript object is garbage collected.
let win

function createWindow() {
    // Create the browser window.
    win = new BrowserWindow({ width: 800, height: 600 })

    // and load the index.html of the app.
    win.loadURL(url.format({
        pathname: path.join(__dirname, 'index.html'),
        protocol: 'file:',
        slashes: true
    }))

    // Open the DevTools.
    win.webContents.openDevTools()

    // Emitted when the window is closed.
    win.on('closed', () => {
        // Dereference the window object, usually you would store windows
        // in an array if your app supports multi windows, this is the time
        // when you should delete the corresponding element.
        win = null
    })
}

// This method will be called when Electron has finished
// initialization and is ready to create browser windows.
// Some APIs can only be used after this event occurs.
app.on('ready', createWindow)

// Quit when all windows are closed.
app.on('window-all-closed', () => {
    // On macOS it is common for applications and their menu bar
    // to stay active until the user quits explicitly with Cmd + Q
    if (process.platform !== 'darwin') {
        app.quit()
    }
})

app.on('activate', () => {
    // On macOS it's common to re-create a window in the app when the
    // dock icon is clicked and there are no other windows open.
    if (win === null) {
        createWindow()
    }
})

// In this file you can include the rest of your app's specific main process
// code. You can also put them in separate files and require them here.

And index.html

<!DOCTYPE html>
<html>
<head>
    <meta charset="UTF-8">
    <title>Hello World!</title>
</head>
<body>
    <h1>Hello World!</h1>
    We are using node
    <script>document.write(process.versions.node)</script>,
    Chrome
    <script>document.write(process.versions.chrome)</script>,
    and Electron
    <script>document.write(process.versions.electron)</script>.
</body>
</html>

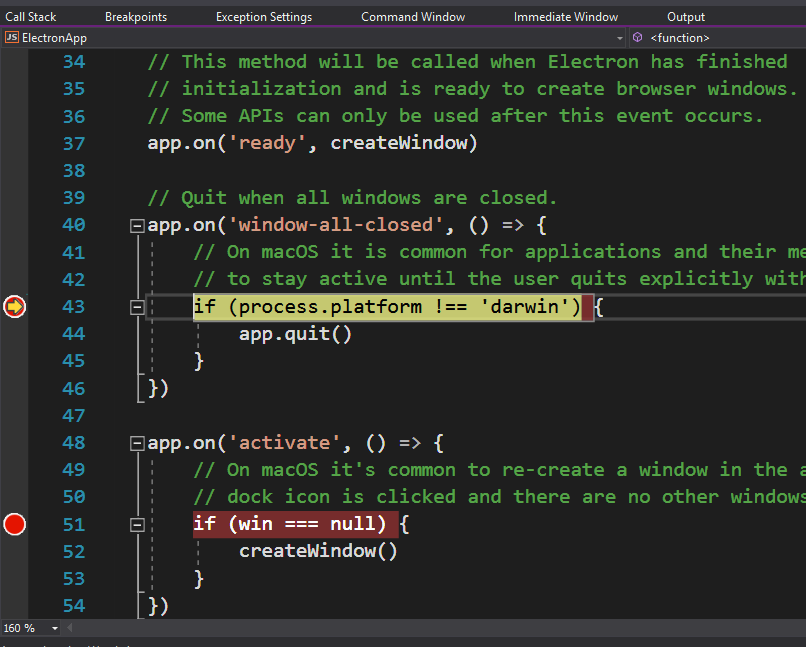
However, when I click start, the electron app starts, but the debugging process seems to detach itself. When I try to manually attach the debugger to all electron process (Debug -> Attach to process -> choose all electron processes), the break point claims not to be hit since no symbols are loaded. enter image description here

This is the project property page: enter image description here

Is there a step that I missed? Since debugging can be done on VSCode, I assume it can also be done in VS2017?

Many thanks.

NOTE: I did check Suppress JIT optimization and uncheck Enable just my code.

Ledesma answered 30/9, 2017 at 6:46 Comment(4)
Are you running your app in debug mode?Firstrate
@Mohamed Chaawa, yes.Ledesma
this is a silly comment because as a programmer I assume you know the diff between a debug and release? you are not trying to attach to a release build are you? you did try to rebuild so debug symbols are updated?Macule
@Aaron. S would it matter? I am debugging a js file and not the internal of electron itself. Electron runs on the js file. The same procedure seems to work well with debugging JavaScript file running on release Google chrome as long as I specify the debugging port correctlyLedesma
E
9

This is actually very easy to do.

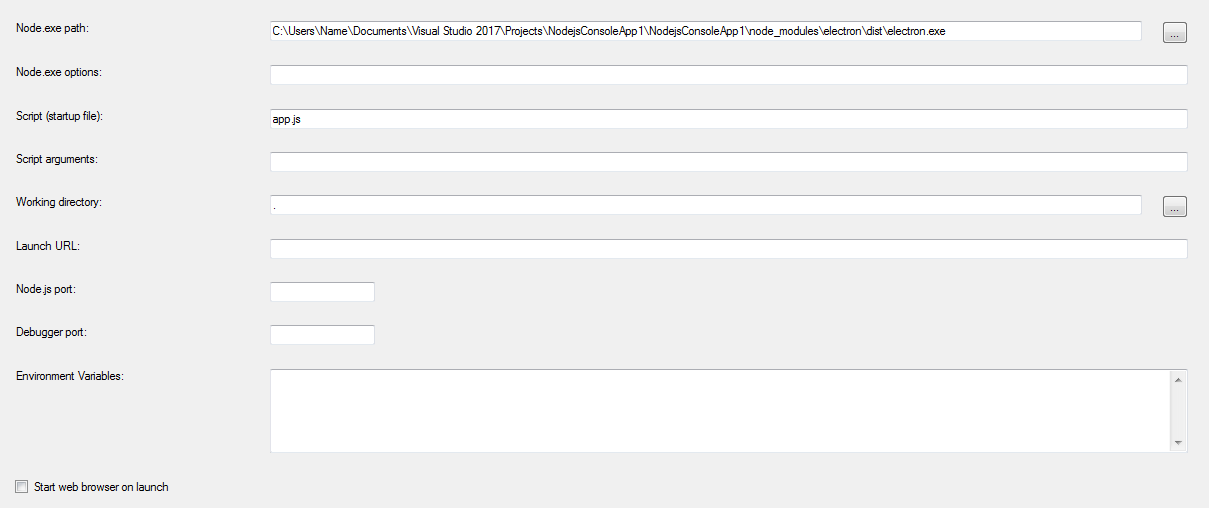
  1. Configure your app in Visual Studio like this:

enter image description here

  1. Start your app. Electron will start on a separate terminal but Visual Studio won't be attached to it.

enter image description here

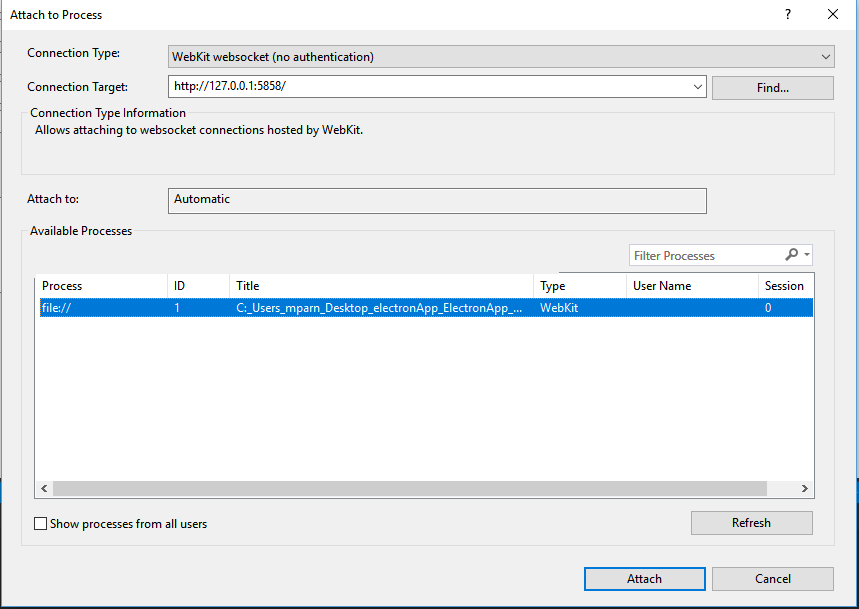
  1. Go to Debug > Attach to process... and enter the Webkit websocket connection type and http://127.0.0.1:5858 as the target. enter image description here

  2. Your breakpoints are now enabled.

enter image description here

Egon answered 10/10, 2017 at 4:48 Comment(3)
ahhh. All this time, I still have to specify the connection target. I thought it is specified in the property file. Nice!Ledesma
I'm not getting the results I'd expect from this. Debugger attaches fine and I can hit breakpoints, but the electron app window doesn't load properly: imgur.com/wsAmql9 I've tried quite a few options in the project's properties, but no-go. Here's the njsproj file in case someone wants to assist: pastebin.com/qF4uCzBc Thanks and cheers!Unconstitutional
@Unconstitutional please post a new question for this. I don't have VS anymoreEgon
U
0

In your "Node.exe Options" field, add --debug=$DEBUG_PORT for NodeJS v6 and below or --inspect=$DEBUG_PORT for NodeJS v7 or greater where $DEBUG_PORT is meant to symbolize the port you have specified in your debug configuration.

If you don't pass a port and only pass the --debug or --inspect flag, then Node debugger listens on ports 5858 and 9229 respectively... they changed the default port to 9229 in later versions of node.

Let me know if this helps!

Unimproved answered 3/10, 2017 at 14:52 Comment(7)
I did that, the program seems to break, but I can't resume running, and breakpoint is still not loaded.Ledesma
Try adding the host and port after the --debug or --inspect flags. For example --inspect=0.0.0.0:9229Unimproved
What would be the host in an electron app?Ledesma
If you are running it on your local machine then it should be localhost... so try: localhost, 127.0.0.1, or 0.0.0.0Unimproved
Sorry for the late reply, I was traveling and did not have access to my computer. Will try it out and get back to you.Ledesma
Does this work? I tried many different combinations of arguments and still couldn't get the breakpoints to be hitEgon
It doesn't seem to work. Though the command prompt does stop and and debugger says they are listening, but can't get the breakpoint to load. I might be missing something here.Ledesma
D
0

For seeing why symbols are not loading type the following commands in Windbg.

> !sym noisy
> .reload /f electron.exe

Creating an Electron app using Visual Studio (not VSCode) w/ Node.js tools

Debbydebee answered 9/10, 2017 at 17:54 Comment(2)
Uhmn... I had a read through, it seems this might work. But I will need to experiment with this more to confirm.Ledesma
I have made some changes in my answer.Debbydebee

© 2022 - 2024 — McMap. All rights reserved.