Google Data Studio: How to count number of specific events
Asked Answered
V

4

16

I know similar questions were asked before, but none of the answers that I found (example here, another example) helped me.


What I am trying to do:

Create a report in Google Data Studio that shows me number of Unique Page Views VS Specific Event. For example: how many users visited page X, and how many of those clicked in button Y.
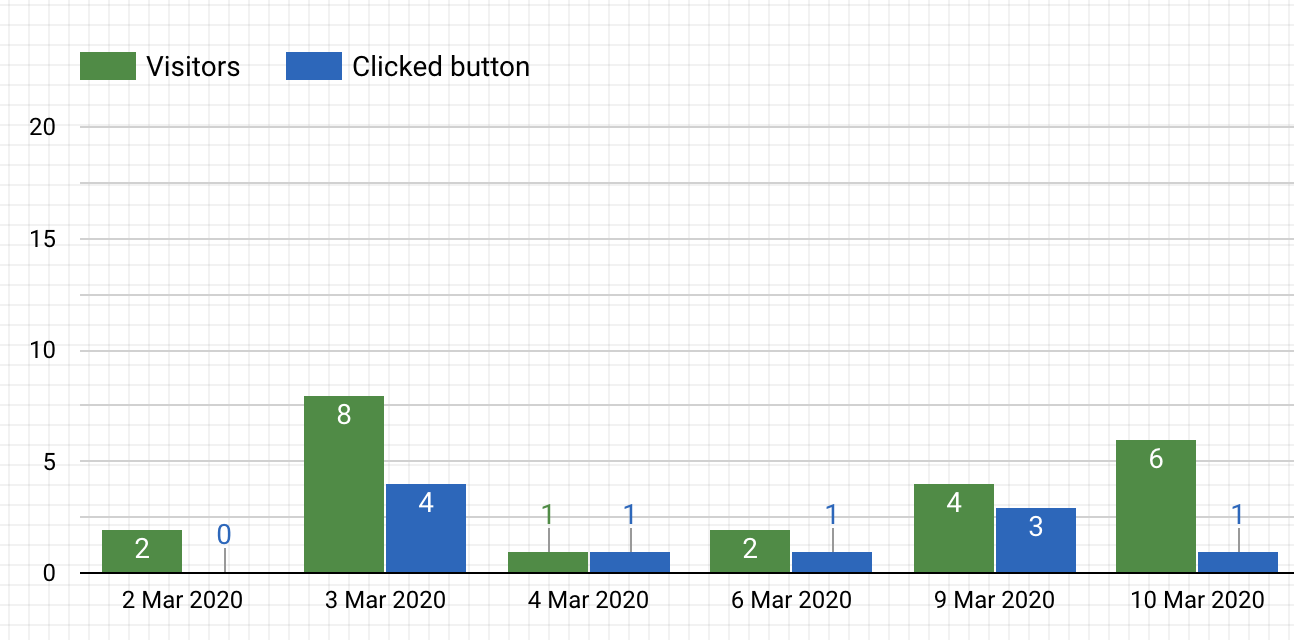
enter image description here (Example of what I am trying to achieve) ☝️


What I already have:

Google Analytics is configured and events are tracked. When I go to Google Analytics I can see the numbers there. Google Data Studio is already connected to my Google Analytics and the numbers are matching.


What I tried so far:

Test 1

Create a chart using Unique Page Views and Unique Events metrics and set a filter with Event Name = "Button clicked", but that filters my Unique Page Views metric and I end up with wrong numbers.

Test 2

Create a Calculated Field using:

SUM(case when REGEXP_MATCH(Event Action, "Button clicked") then 1 else 0 end)

or using:

COUNT(case when REGEXP_MATCH(Event Action, "Button clicked" ) then "Button clicked" else NULL end)

But this only returns 1


Appreciate any other ideas πŸ’‘

Verbality answered 27/3, 2020 at 3:3 Comment(2)
There is no Unique Visitors metric in Google Analytic, Visitors are already unique count. In test 1 you mentioned Unique Page Views, is it the metric that you want to put on the plot? – Newish
Sorry, that should by Unique Page Views, you are right. Fixed that in the question. – Verbality
N
11

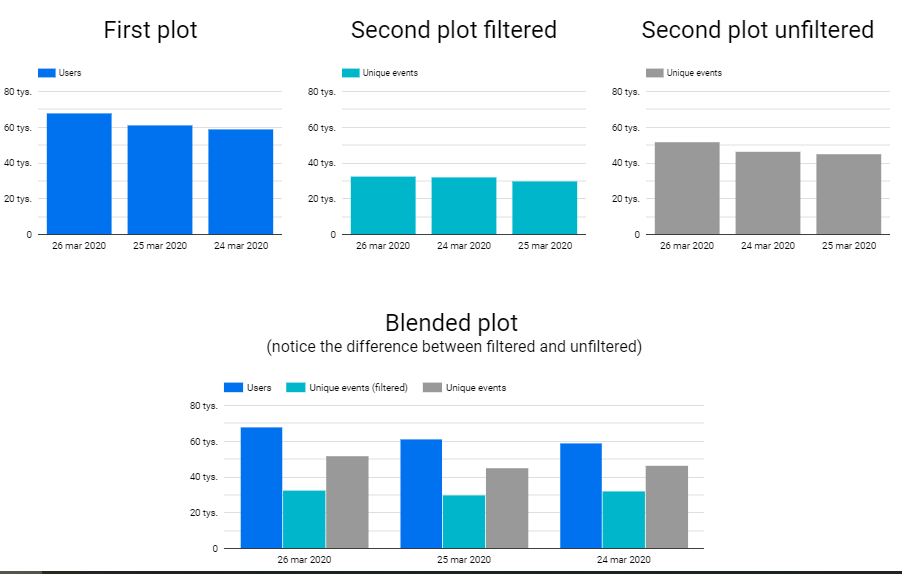
Try data blending feature:

  1. Create first plot with Visitors/Users or Unique Page View.
  2. Create second plot with Unique Event filtered as you want.
  3. Select both plots, right-click on one of them, select Blend data.

Example (with addition of unfiltered plot for comparison): Plot comparison

Newish answered 27/3, 2020 at 8:25 Comment(3)
Sure, but this is kind of a workaround. Is there a way to keep only the blended plot / hide the first / second plot? – Prentice
Hi @HugodeHeer - what do you mean by that? On the screenshot I included 4 plots just for the sake of comparison. After blending the data you can visualize any part of it you need. You don't have to keep plots used for creating a blend and you can create blend without making initial plots too by going into Resources > Manage blends and creating one. – Newish
Ah great! It creates a new blended dataset, so i can indeed remove the first en second plots Got it working now :) – Prentice
H
0

I'm not sure if this is related to Google Analytics 4 data, but that is how I wound up reading this post. I have found a solution. If you would like to pull specific events as a metric, just do the following:

SUM(IF(Event name - GA4="G1_COMPLETION",Event count - GA4,0))
Haplosis answered 16/8, 2022 at 10:4 Comment(1)
I've tried exactly this on my report, and I get this error message: " Sorry, calculated fields can't mix metrics (aggregated values) and dimensions (non-aggregated values). Please check the aggregation types of the fields used in this formula. Learn more. " ("learn more" leads here: support.google.com/looker-studio/answer/…) – Umiak
R
0

The post by Cmoz works for me, but after I first created a data extract, and ran the calculated field on that datasource

Ruscher answered 23/12, 2022 at 0:39 Comment(1)
Your answer could be improved with additional supporting information. Please edit to add further details, such as citations or documentation, so that others can confirm that your answer is correct. You can find more information on how to write good answers in the help center. – Vivie
F
-1

Here is a solution but in my case - I joined not just 2 tables but also it was necessary to join 1 more table just with the date. Where we blend data - we join table 2 with table 1 and table 3 with table 1 also the result of blending data

data blending setup

Join configuration

Formularize answered 21/5, 2022 at 5:47 Comment(1)
As it’s currently written, your answer is unclear. Please edit to add additional details that will help others understand how this addresses the question asked. You can find more information on how to write good answers in the help center. – Vivie

© 2022 - 2024 β€” McMap. All rights reserved.