Java Code Coverage in Visual Studio Code
Asked Answered
M

2

16

I am using VSC for my Java project with maven help. I would like to use a Code Coverage tool but I lost the directions in the many possibilities you have.
My goals are:

  • run the Code Coverage goal with Maven;
  • Display the test coverage in VSC with a plugin like Coverage Gutter

Which Code Code coverage tool to use?
Can someone show me the right Maven plugin and the way to configure VSC?

Thanks,
S.

Mullock answered 22/8, 2018 at 9:49 Comment(0)
M
7

Prerequisites

  • Java Extension Pack extension
  • Coverage Gutters extension by ryanluker: To display test coverage generated
  • Live Preview extension by Microsoft: To render HTML files in VSCode
  • A maven project with some tests

Steps

Add the jacoco-maven-plugin to your pom.xml file. This plugin will generate a report of your code coverage.

<plugin>
    <groupId>org.jacoco</groupId>
    <artifactId>jacoco-maven-plugin</artifactId>
    <version>0.8.4</version>
    <executions>
        <execution>
            <goals>
                <goal>prepare-agent</goal>
            </goals>
        </execution>
        <execution>
            <id>report</id>
            <phase>prepare-package</phase>
            <goals>
                <goal>report</goal>
            </goals>
        </execution>
    </executions>
</plugin>

Generate the jacoco report by running the following command in your terminal:

mvn jacoco:prepare-agent test install jacoco:report

You should see a newly created file target/site/jacoco/index.html.

NOTE: Each time you make a change to your tests, you need to rerun the above command to ensure that the code coverage report is accurate.

View detailed report

Open the HTML file (target/site/jacoco/index.html) and click on the magnify icon in the top right corner of VS Code. (Live Preview extension must be installed) enter image description here

enter image description here

Show inline coverage

Click on Watch in the bottom left toolbar of your VS Code. (Code Gutters extension must be installed) enter image description here

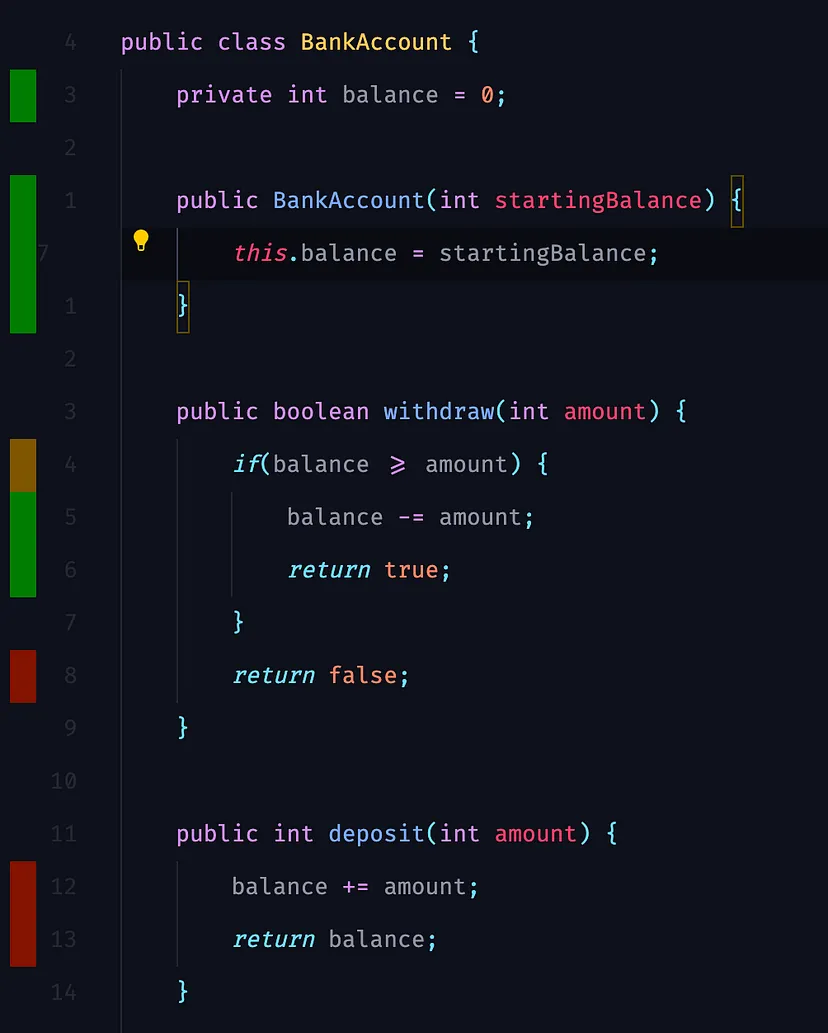
Check out the class for which you wrote tests: enter image description here

Green bars indicate that that code has been reached by your tests. Orange bars indicate a missed conditional check. Red bars indicate code that was not reached by your tests.

References

Malone answered 11/11, 2023 at 7:5 Comment(3)
I'm finding the code coverage to be inaccurate. The code gutter and coverage report are showing uncovered code, yet I have unit tests that do cover the code, verified by setting a breakpoint in the code and debugging the unit test(s).Follower
@Follower I have not faced this issue yet so I don't really know how to help you. If your problem persists, I recommend creating an issue on the code gutters Github repository.Malone
@Follower Whenever you make a change to your tests, don't forget to regenerate the jacoco report manually using mvn jacoco:prepare-agent test install jacoco:report otherwise the code coverage will be inaccurate.Malone
G
4

For now, I don't think there is a way to show coverage inline for java code. This is not really an answer to your question but it may help. You can run tests (maybe create a task in vscode) then watch code coverage report in the browser. For gradle it is:

./gradlew test jacocoTestReport

And then check the report at build/TestCoverageReport/test/html/index.html

You can do that also easily with maven.

Gangplank answered 8/1, 2019 at 11:24 Comment(1)
if your here for coverage report check link coverage with maven >> eclemma.org/jacoco/trunk/doc/maven.htmlPrather

© 2022 - 2024 — McMap. All rights reserved.