Change colours to defined palette for ggplot objects
Asked Answered
M

1

16

I would like to change the default colours to a specific palette for all geom_* type objects by using a function.

Below is an example for geom_line() and using the function change_colours()

# load ggplot2 and tidyr library
require(ggplot2)
require(tidyr)

# create a mock data frame
df <- data.frame(cbind(var1=500*cumprod(1+rnorm(300, 0, 0.04)),
                       var2=400*cumprod(1+rnorm(300, 0, 0.04)),
                       var3=300*cumprod(1+rnorm(300, 0, 0.04))))
df$TS <- as.POSIXct(Sys.time()+seq(300))
df <- gather(df, stock, price, -TS)

# create basic base graph
p <- ggplot(df, aes(x=TS, y=price, group=stock))+geom_line(aes(colour=stock))

# custom pallet
custom_pal <- c("#002776", "#81BC00", "#00A1DE", "#72C7E7", "#3C8A2E", "#BDD203", 
                "#313131", "#335291", "#9AC933", "#33B4E5", "#8ED2EC", "#63A158", 
                "#CADB35", "#575757", "#4C689F", "#A7D04C", "#4CBDE8", "#9DD8EE", 
                "#76AD6D", "#D1DF4F", "#8C8C8C", "#7F93BA", "#C0DE80", "#80D0EE", 
                "#B8E3F3", "#9DC496", "#DEE881", "#B4B4B4", "#99A9C8", "#CDE499", 
                "#99D9F2", "#C7E9F5", "#B1D0AB", "#E5ED9A", "#DCDCDC")

# the function the change colours
change_colours <- function(ggplot_obj, pal){
  p <- ggplot_obj
  group_data <- p$data[, as.character(p$mapping$group)]
  n_groups <- length(unique(group_data))
  group_data_cols <- pal[group_data]

  p + theme_light()+ geom_line(colour=group_data_cols)
}

p
p1 <- change_colours(ggplot_obj=p, pal=custom_pal)
p1

I am hoping to change the change_colours() function to be more generic for all geom_* type layers

Any help would be much appreciated.

Myotonia answered 4/1, 2016 at 22:41 Comment(2)
I don't get the question. It seems to be that your code is already doing what you asked for. What is your request?Loadstar
Ah, I get it. For all of the primitives...Loadstar
S
13

The following should do what you're after. Note that it only changes colours that are mapped to variables. Colour passed directly to the geom_* won't be affected (there's an example below). For an approach that modifies colour or fill (whichever is mapped first), see the bottom half of this post.

change_colours <- function(p, palette) {
  n <- nlevels(p$data[[deparse(p$mapping$group)]])
  tryCatch(as.character(palette), 
           error=function(e) stop('palette should be a vector of colours', call.=FALSE))
  if(n > length(palette)) stop('Not enough colours in palette.')
  pal <- function(n) palette[seq_len(n)]
  p + theme_light() + discrete_scale('colour', 'foo', pal)
}

# Here, df is from the OP's post
p <- ggplot(df, aes(x=TS, y=price, group=stock)) 

Examples:

# NB: custom_pal is defined in the OP's post
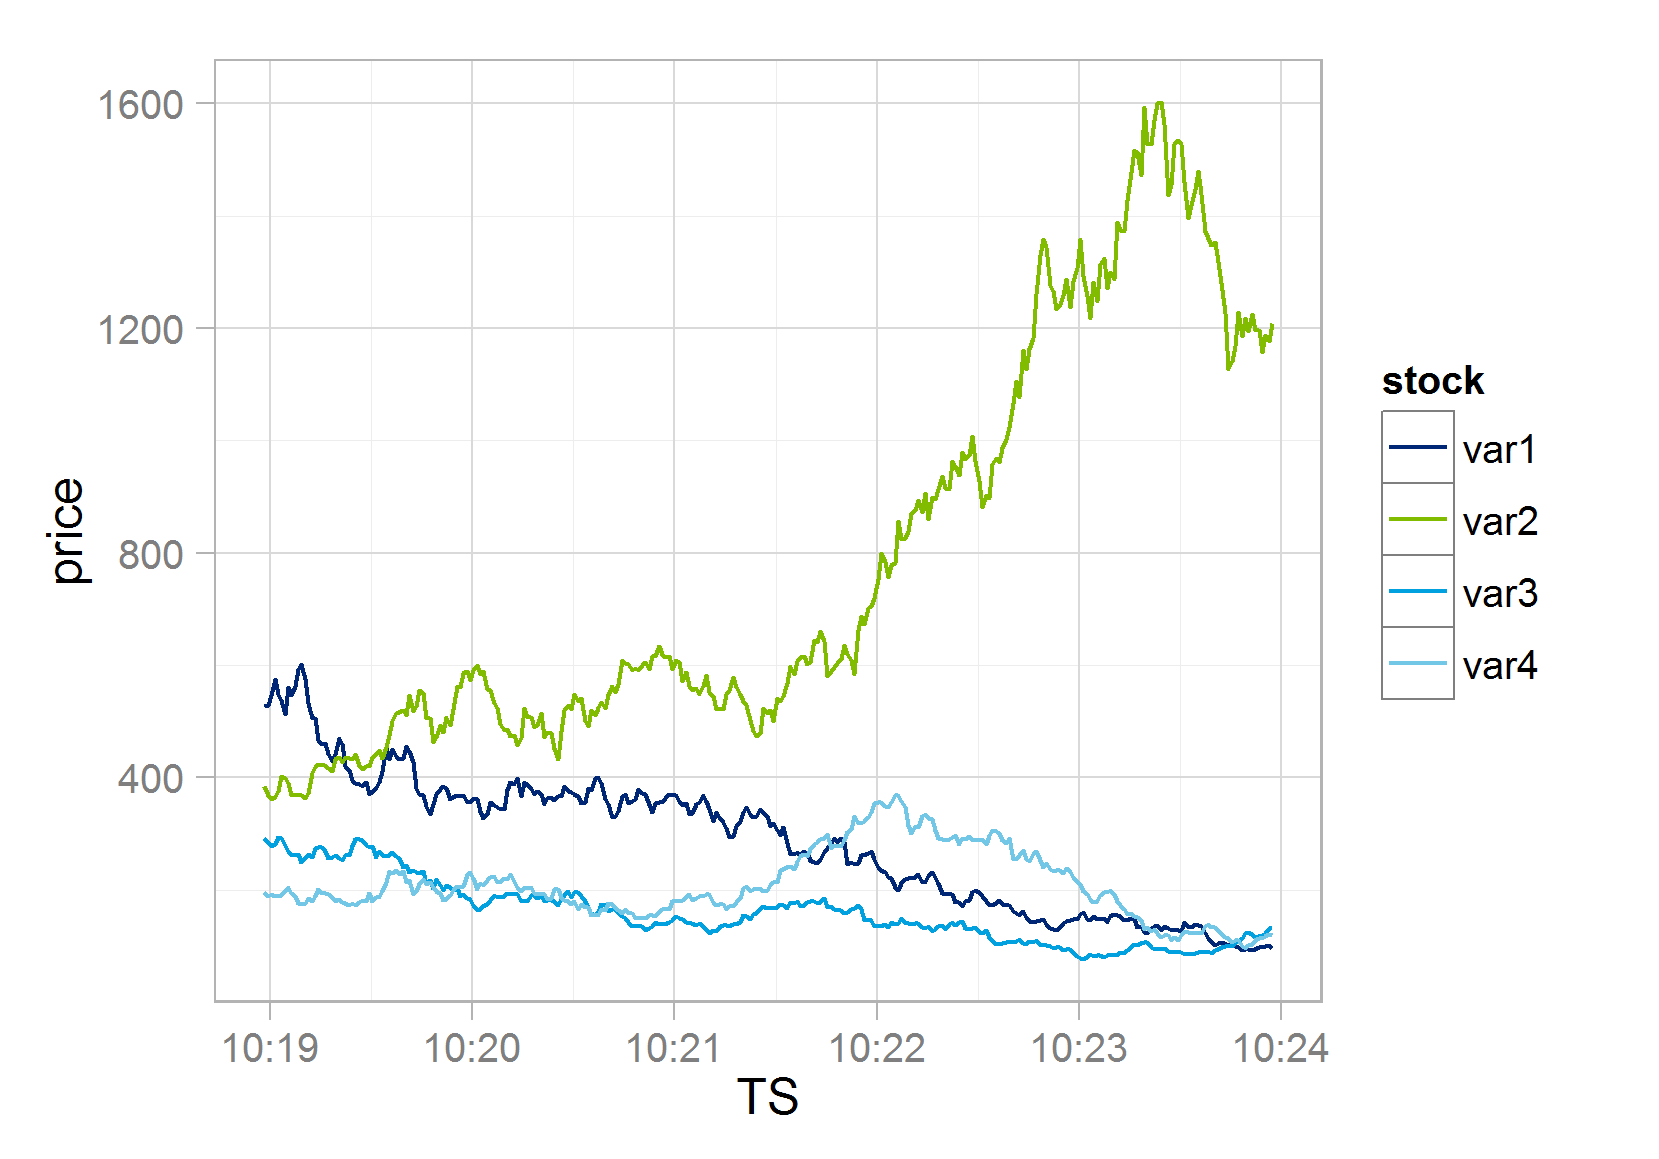
change_colours(p + geom_line(aes(colour=stock)), custom_pal)

enter image description here

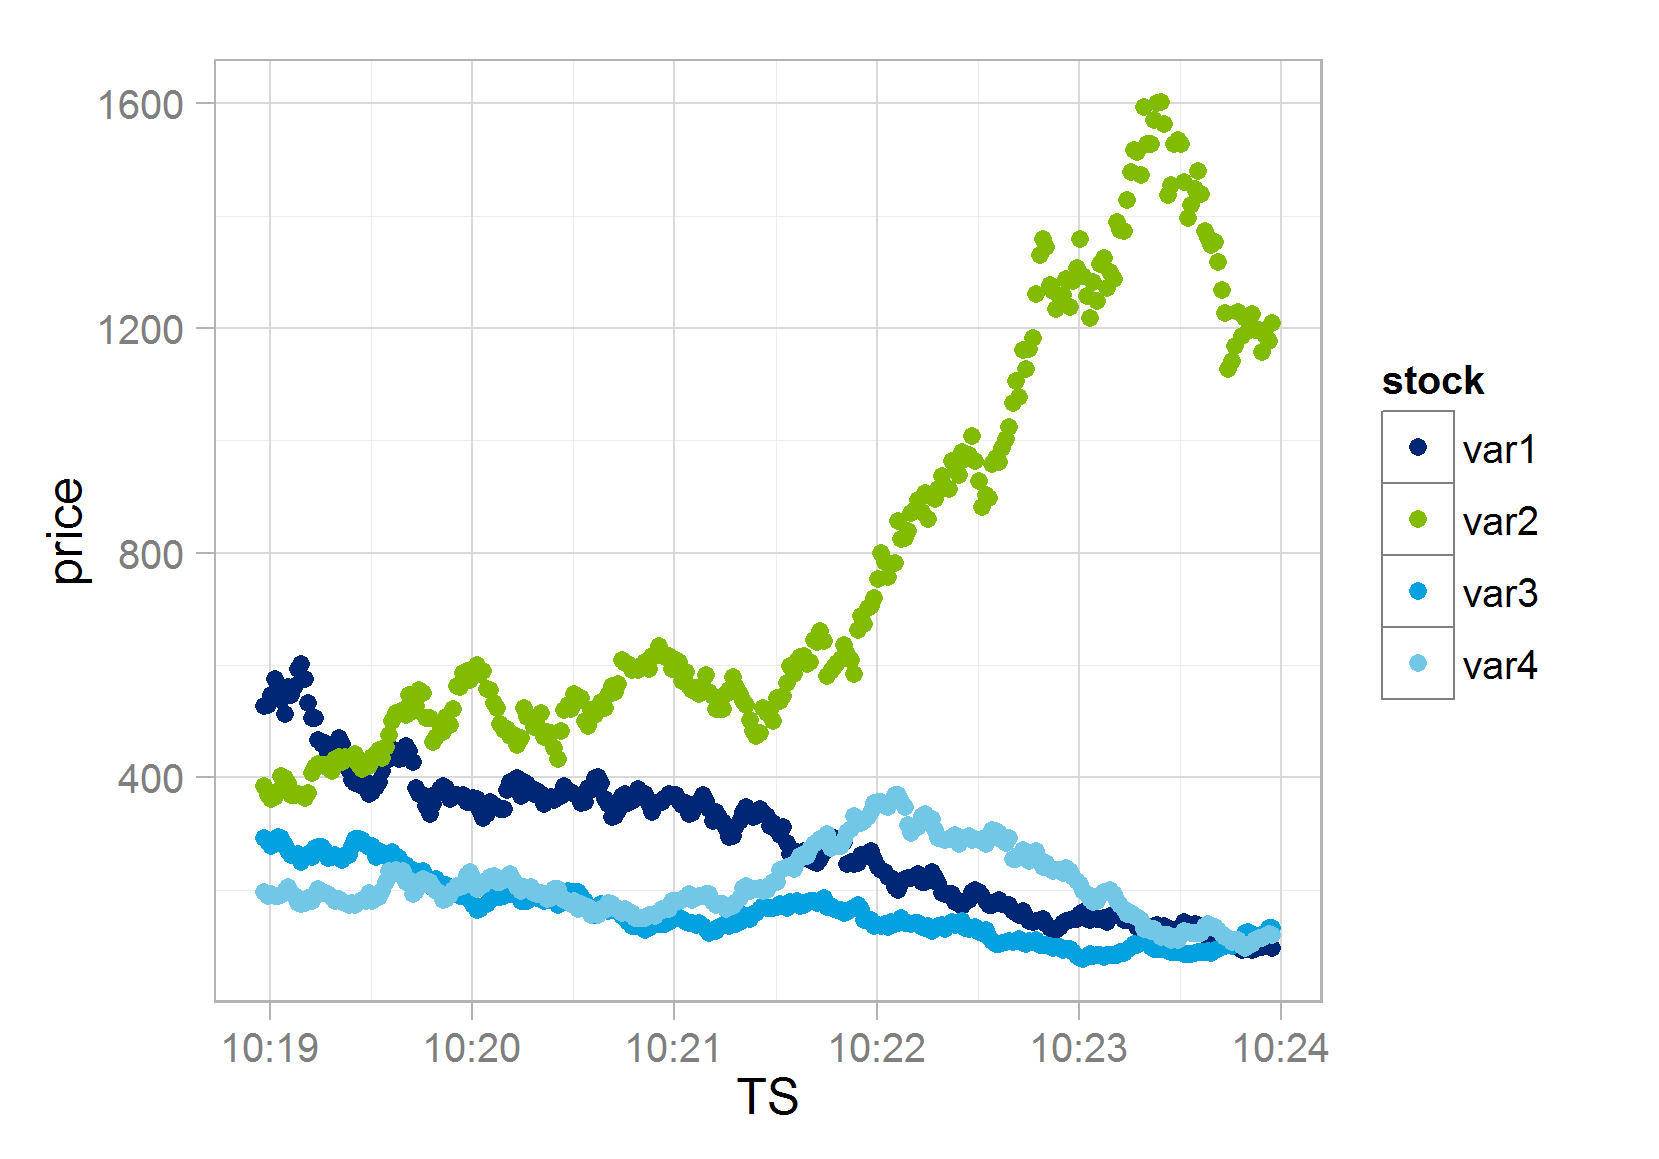
change_colours(p + geom_point(aes(colour=stock)), custom_pal)

enter image description here

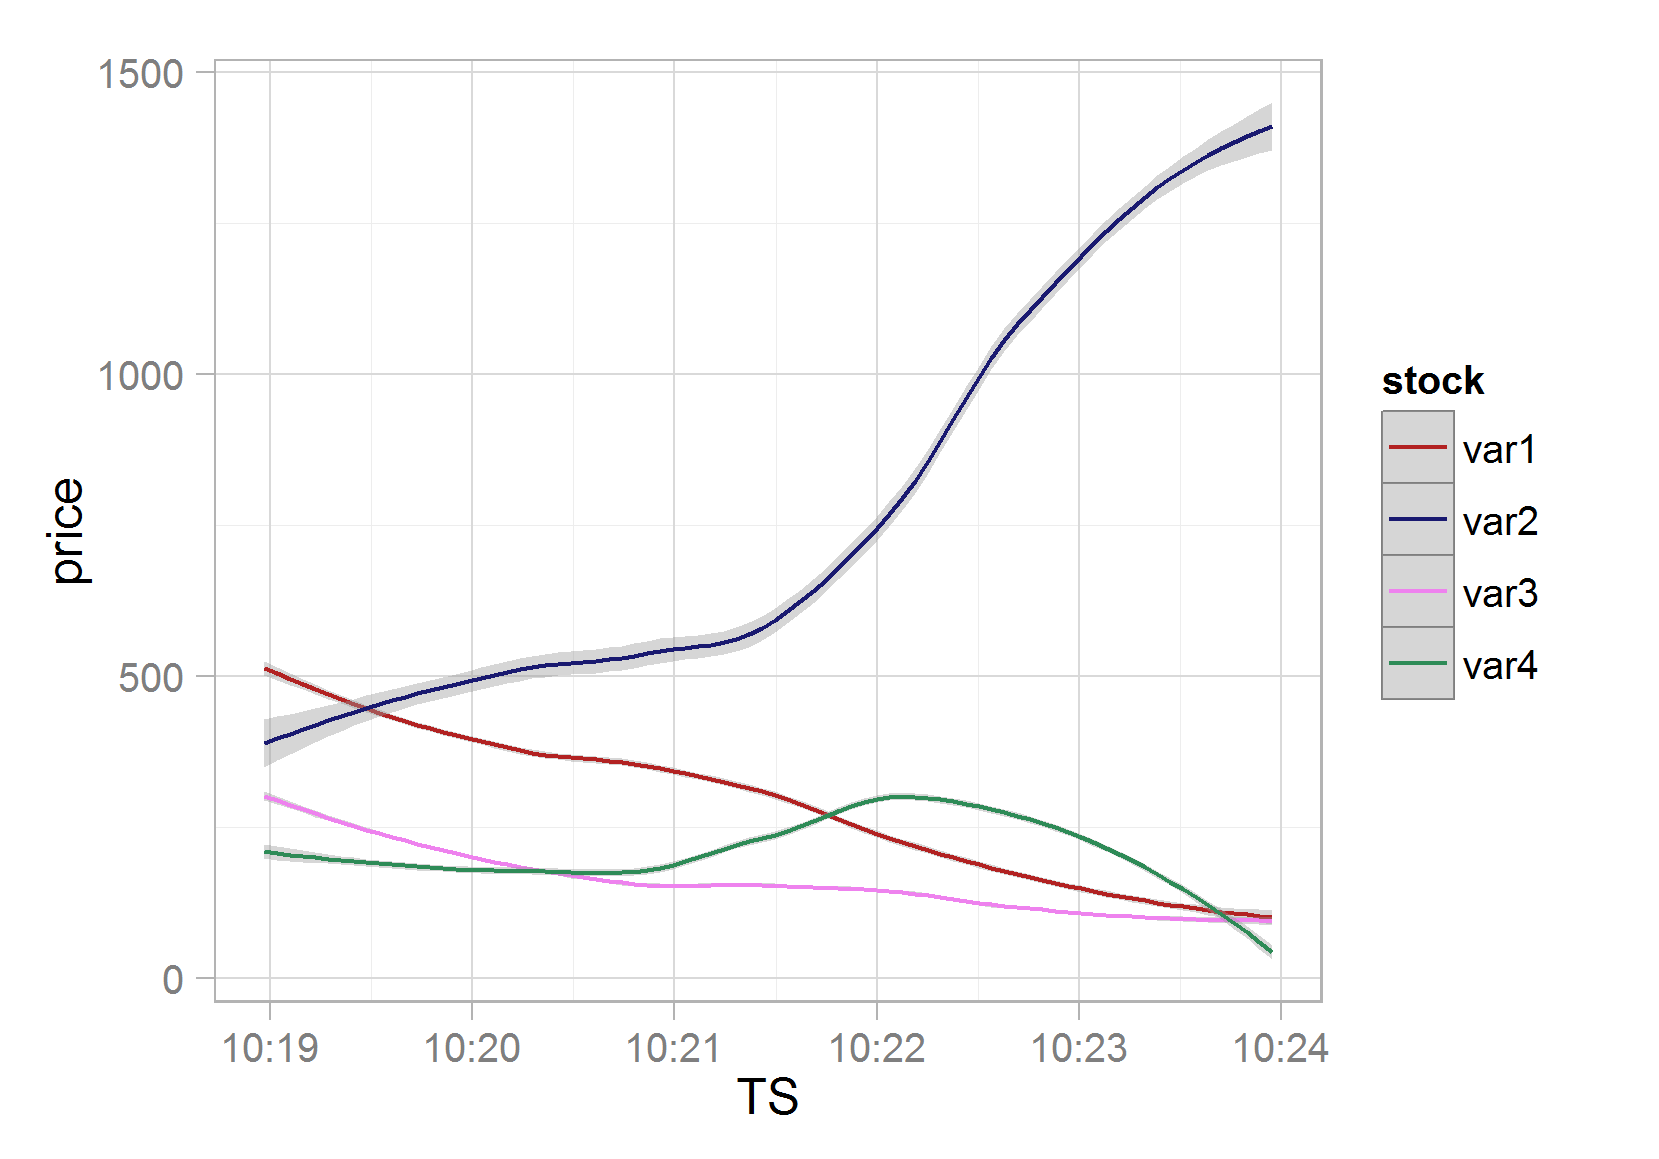
And with a different palette:

change_colours(p + geom_smooth(aes(colour=stock)), 
               c('firebrick', 'midnightblue', 'violet', 'seagreen'))

enter image description here

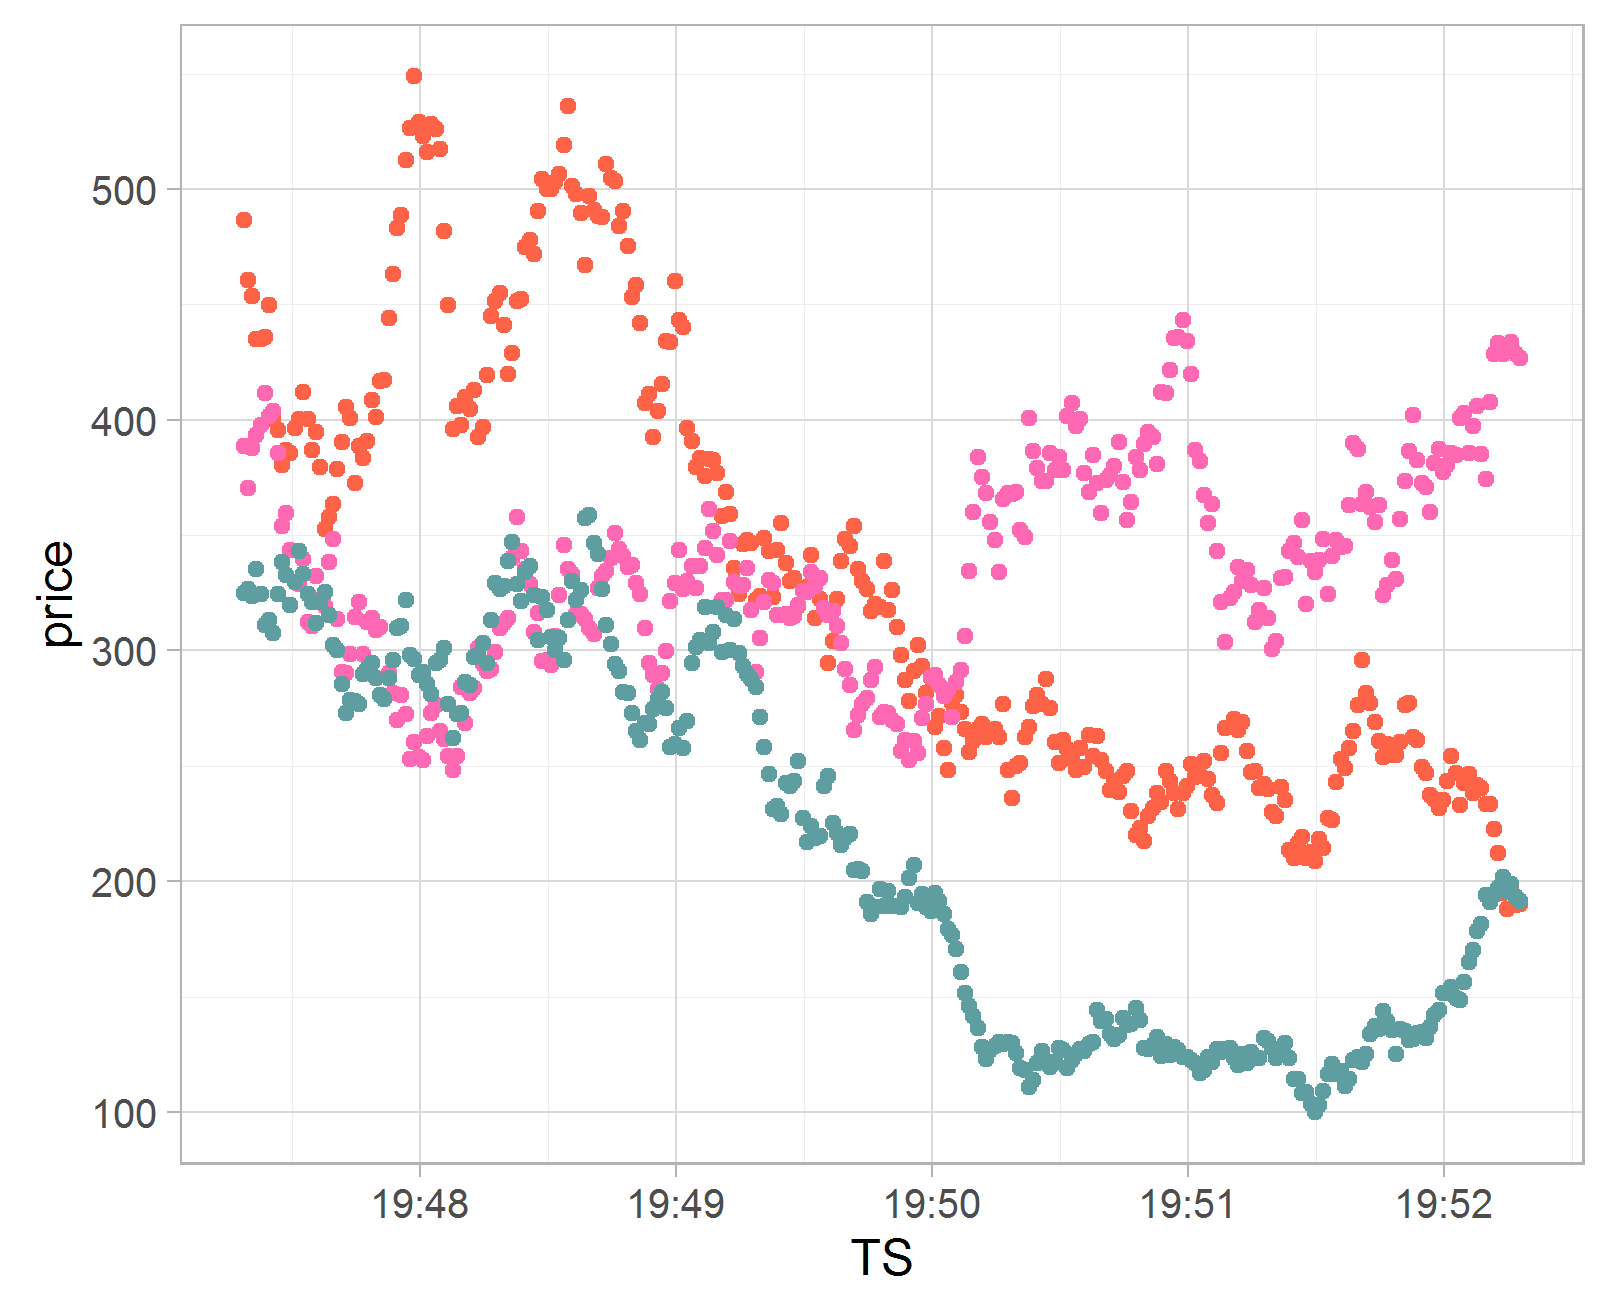
As mentioned above, this will only change colour and fill that are mapped to variables. For example, it'll have no effect on the colours for the following:

change_colours(p + geom_point(colour=rep(c('tomato', 'hotpink', 'cadetblue'), each=300)), 
               custom_pal)

enter image description here


In response to the OP's comment, you can easily detect what types of mappings are being used (e.g. alpha, colour, fill). Just look at p$layers[[1]]$mapping.

If we assume that the first fill or colour mapping of the first layer is the mapping for which you want to change colours, you can do:

change_colours <- function(p, palette, type) {
  n <- nlevels(p$data[[deparse(p$mapping$group)]])
  tryCatch(as.character(palette), 
           error=function(e) stop('palette should be a vector of colours', call.=FALSE))
  if(n > length(palette)) stop('Not enough colours in palette.')
  if(missing(type)) 
    type <- grep('colour|fill', names(p$layers[[1]]$mapping), value=TRUE)[1]
  pal <- function(n) palette[seq_len(n)]
  p + theme_light() + discrete_scale(type, 'foo', pal)
}

# Here, df is from the OP's post
p <- ggplot(df, aes(x=TS, y=price, group=stock))

Examples:

Changing fill instead of colour:

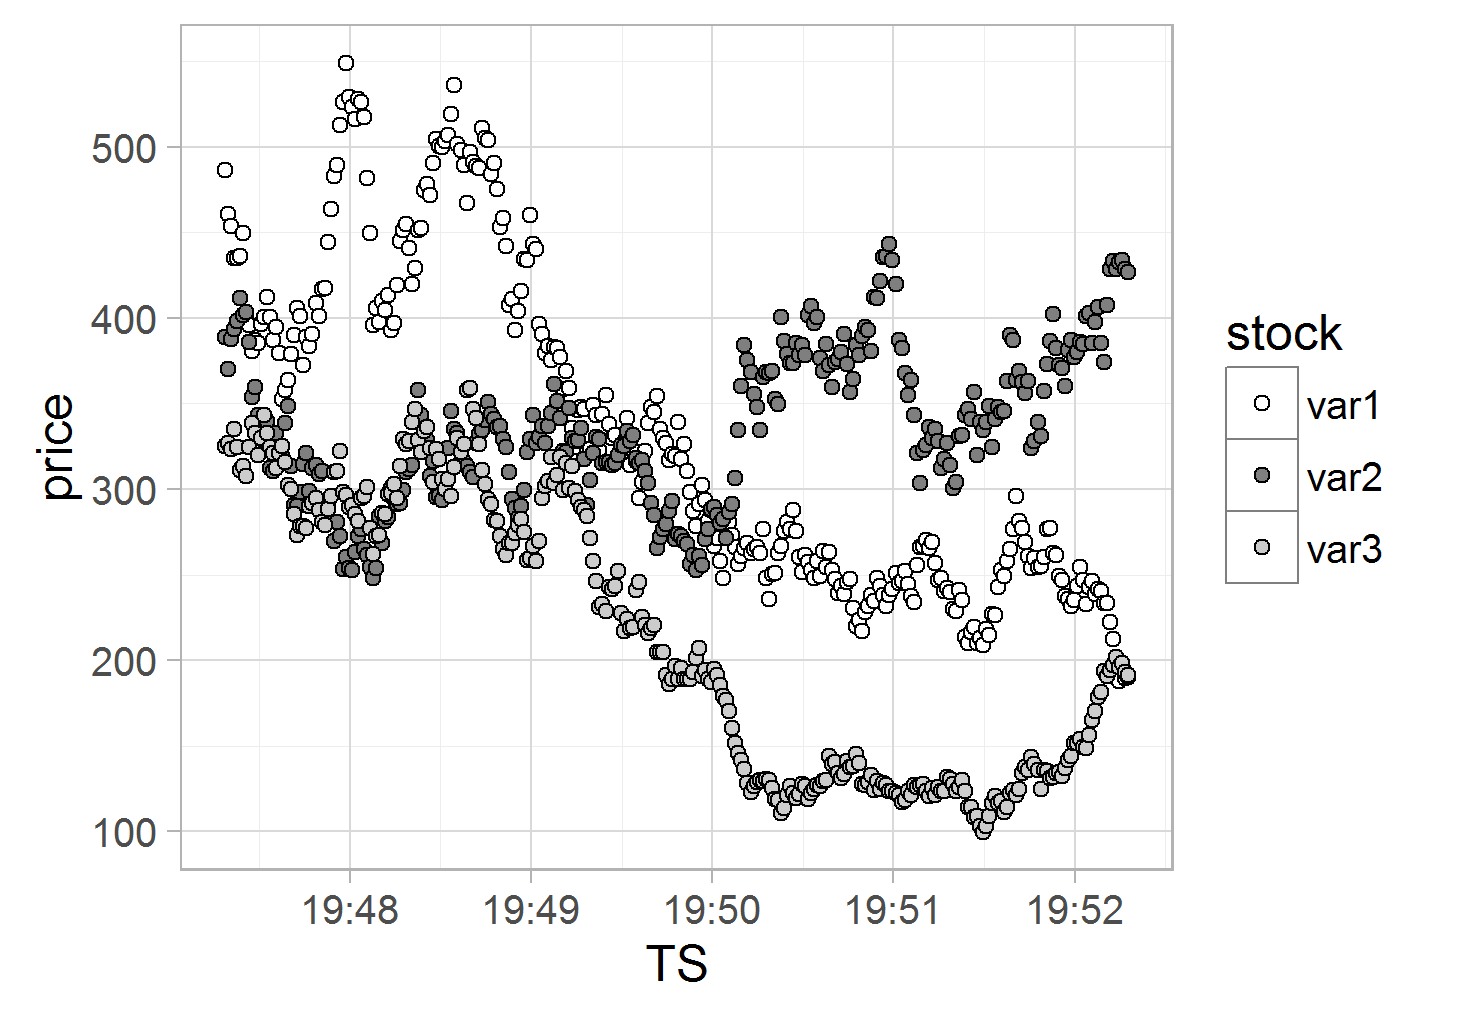
change_colours(p + geom_point(aes(fill=stock), pch=21), 
               c('white', 'grey50', 'grey80'))

enter image description here

Showing priority of first mapped colour/fill aesthetic:

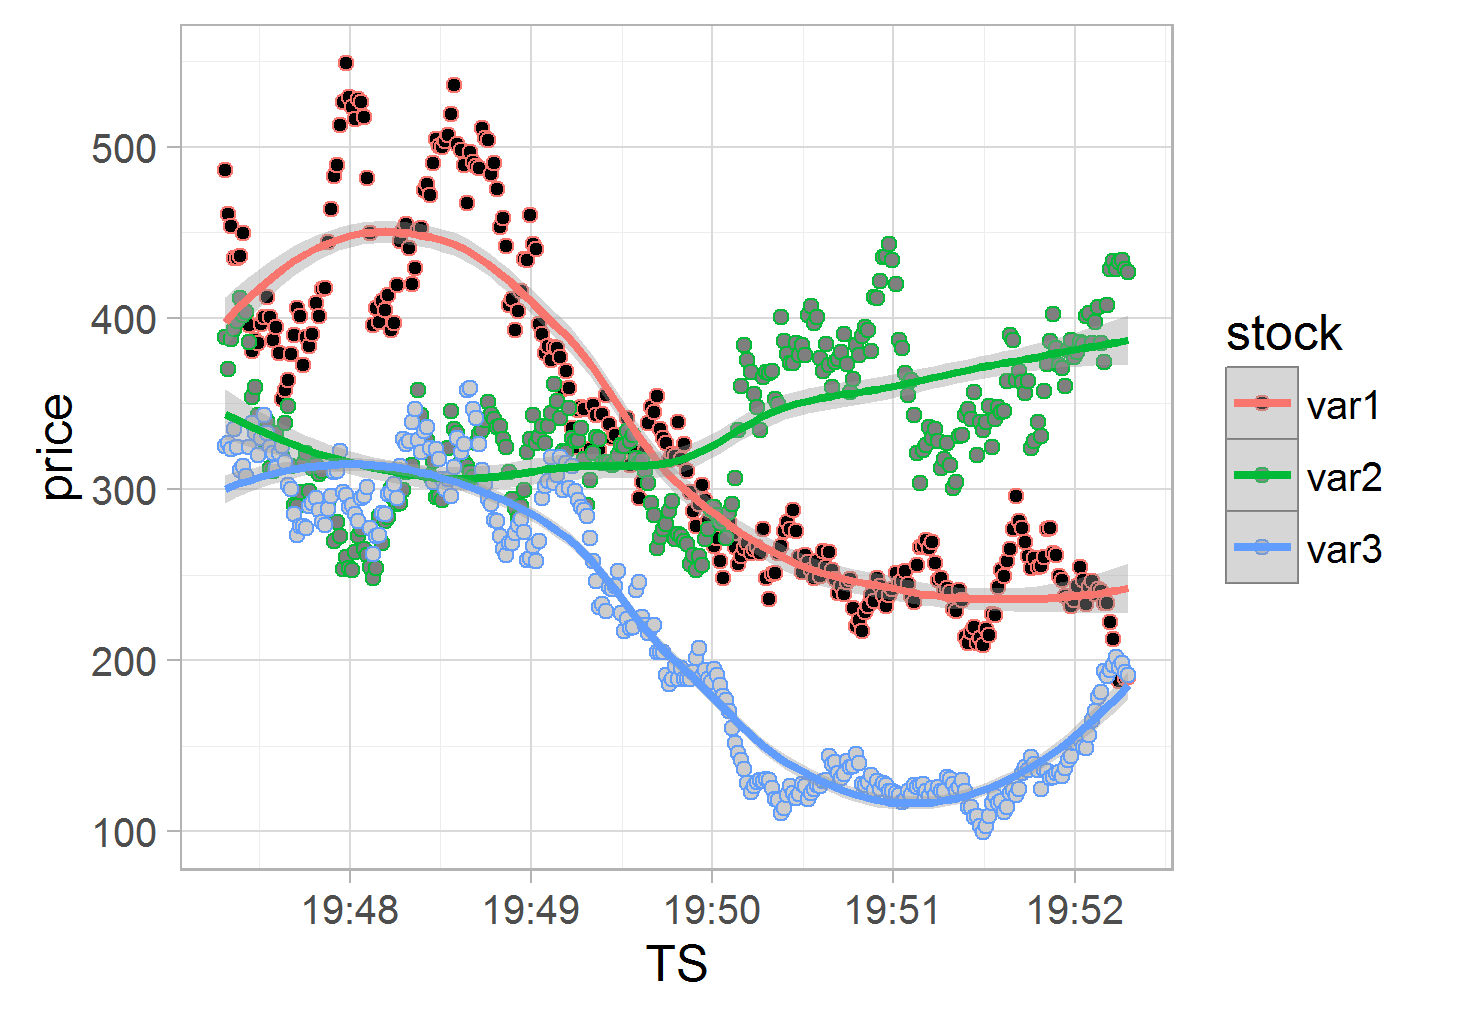
change_colours(p + geom_point(aes(fill=stock, color=stock), pch=21) +
                 geom_smooth(aes(color=stock)), 
               c('black', 'grey50', 'grey80'))

enter image description here

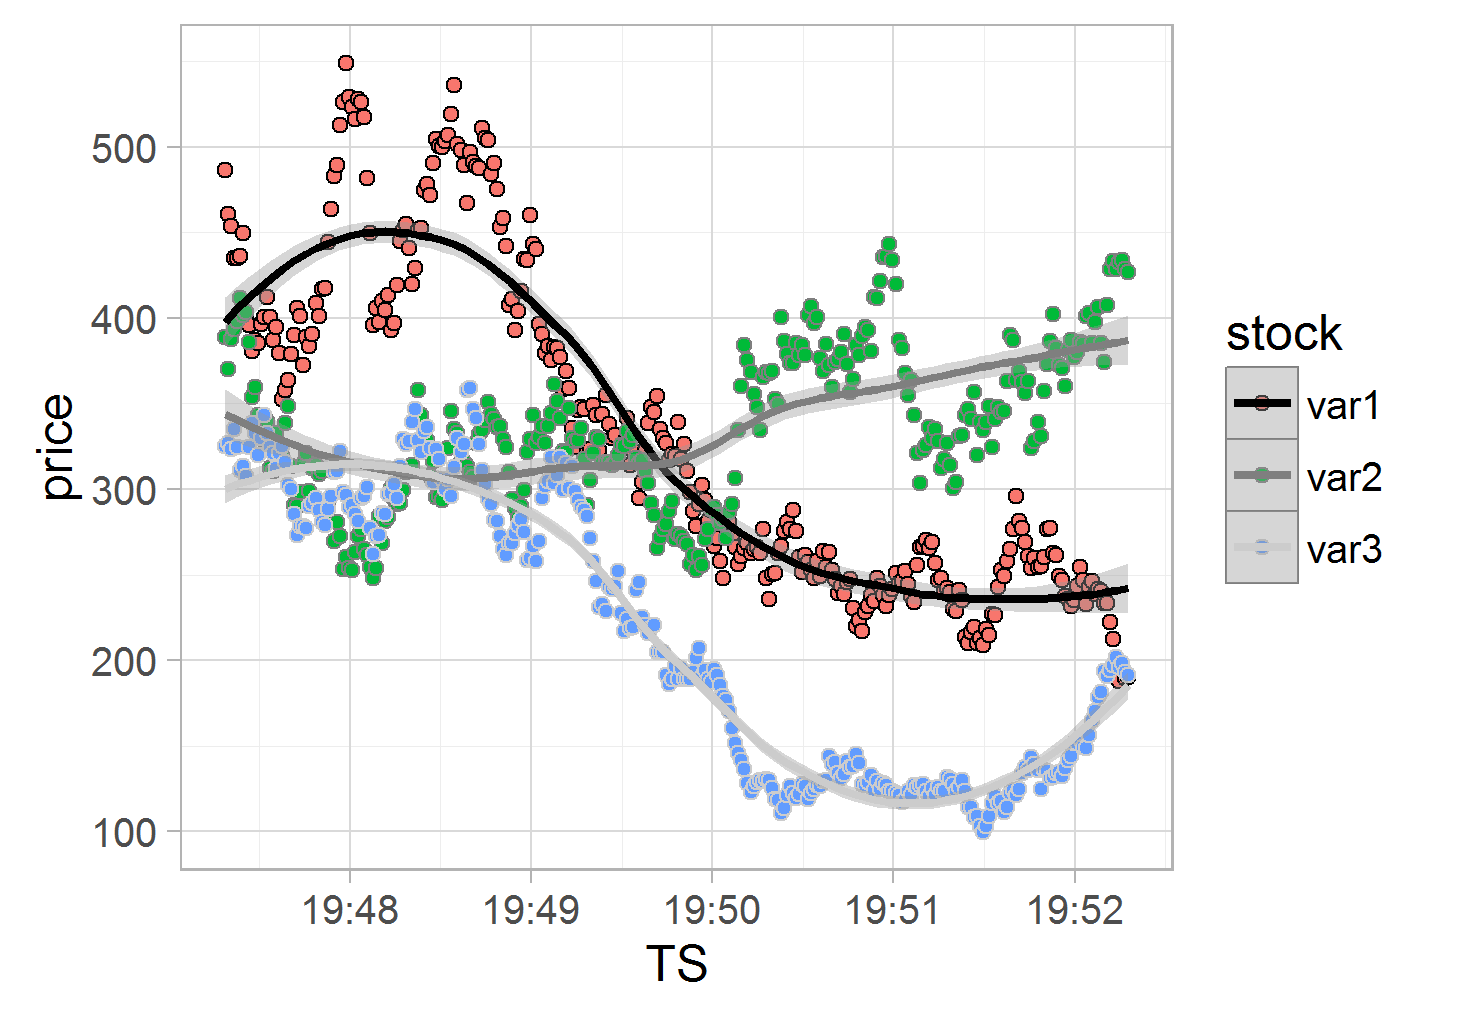
change_colours(p + geom_point(aes(color=stock, fill=stock), pch=21) +
                 geom_smooth(aes(color=stock)), 
               c('black', 'grey50', 'grey80'))

enter image description here

Override the priority of the first mapped aesthetic with the type argument, e.g.:

change_colours(p + geom_point(aes(color=stock, fill=stock), pch=21) +
                 geom_smooth(aes(color=stock)), 
               c('black', 'grey50', 'grey80'), type='fill')
Startle answered 4/1, 2016 at 23:26 Comment(1)
Is there a way to check to see if/detect if fill is being used or colour is being used as the 'main' colouring 'brush'? e.g. when trying: df2 <- df %>% group_by(stock) %>% summarise(mean_px=mean(price)); p2 <- ggplot(df2,aes(x=stock,y=mean_px))+geom_bar(aes(fill=stock),stat='identity') then the new change_colours function doesn't quite work...Myotonia

© 2022 - 2024 — McMap. All rights reserved.