seasonal decompose in python
Asked Answered
C

1

16

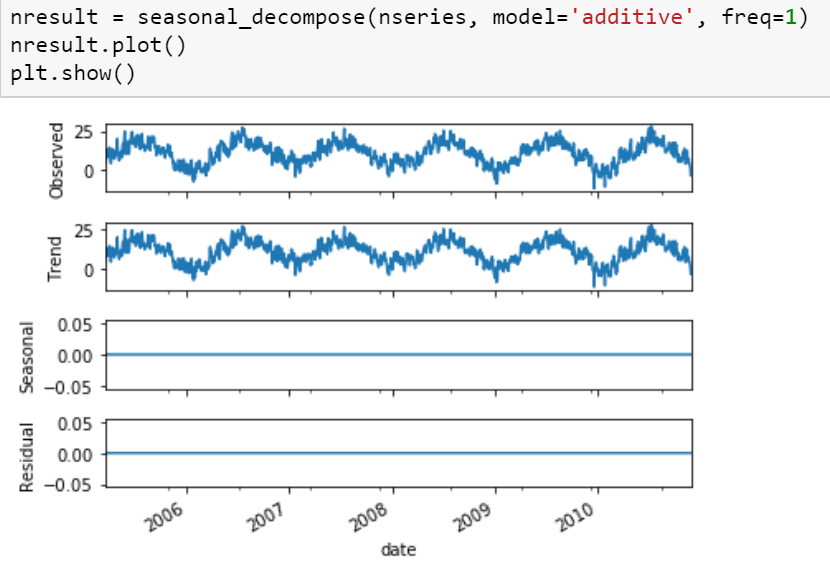
I have a CSV file that contains the average temperature over almost 5 years. After decomposition using seasonal_decompose function from statsmodels.tsa.seasonal, I got the following results. Indeed, the results do not show any seasonal! However, I see a clear sin in the trend! I am wondering why is that and how can I correct it? Thank you.

nresult = seasonal_decompose(nseries, model='additive', freq=1)
nresult.plot()
plt.show()

enter image description here

Continuator answered 2/12, 2017 at 15:39 Comment(1)
I had a problem similar to this one when the time series I created hadn't a time index. That way, the decomposition algorithm couldn't evaluate the frequency. Just like @fuglede commented. Can't you share the shape of your time series, and most importantly how you created it ?Unknit
P
16

It looks like your freq is off.

import numpy as np
import pandas as pd
from statsmodels.tsa.seasonal import seasonal_decompose

# Generate some data
np.random.seed(0)
n = 1500
dates = np.array('2005-01-01', dtype=np.datetime64) + np.arange(n)
data = 12*np.sin(2*np.pi*np.arange(n)/365) + np.random.normal(12, 2, 1500)
df = pd.DataFrame({'data': data}, index=dates)

# Reproduce the example in OP
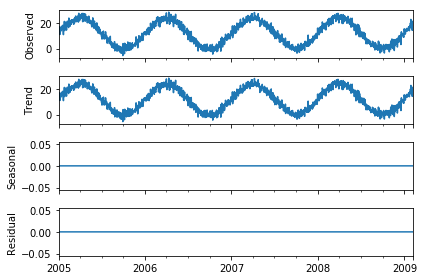
seasonal_decompose(df, model='additive', freq=1).plot()

enter image description here

# Redo the same thing, but with the known frequency
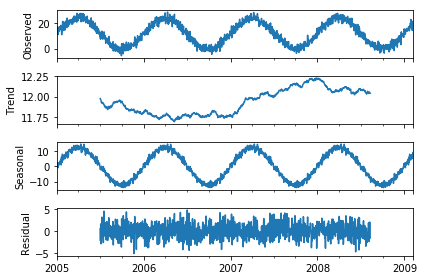
seasonal_decompose(df, model='additive', freq=365).plot()

enter image description here

Palladio answered 2/12, 2017 at 16:42 Comment(1)
how can I adjust my frequency right? If i have two years of weekly data, what should be my freq, is freq=52? in htis case it would be emptyAppendix

© 2022 - 2024 — McMap. All rights reserved.