How to use the cross-spectral density to calculate the phase shift of two related signals
Asked Answered
C

3

16

I've two signals, from which I expect that one is responding on the other, but with a certain phase shift.

Now I would like to calculate the coherence or the normalized cross spectral density to estimate if there is any causality between the input and output to find out on which frequencies this coherence appear.

See for example this image (from here) which seems to have high coherence at the frequency 10: enter image description here

Now I know that I can calculate the phase shift of two signals using the cross-correlation, but how can I use the coherence (of frequency 10) to calculate the phase shift?

Code for image:

"""
Compute the coherence of two signals
"""
import numpy as np
import matplotlib.pyplot as plt

# make a little extra space between the subplots
plt.subplots_adjust(wspace=0.5)

nfft = 256
dt = 0.01
t = np.arange(0, 30, dt)
nse1 = np.random.randn(len(t))                 # white noise 1
nse2 = np.random.randn(len(t))                 # white noise 2
r = np.exp(-t/0.05)

cnse1 = np.convolve(nse1, r, mode='same')*dt   # colored noise 1
cnse2 = np.convolve(nse2, r, mode='same')*dt   # colored noise 2

# two signals with a coherent part and a random part
s1 = 0.01*np.sin(2*np.pi*10*t) + cnse1
s2 = 0.01*np.sin(2*np.pi*10*t) + cnse2

plt.subplot(211)
plt.plot(t, s1, 'b-', t, s2, 'g-')
plt.xlim(0,5)
plt.xlabel('time')
plt.ylabel('s1 and s2')
plt.grid(True)

plt.subplot(212)
cxy, f = plt.cohere(s1, s2, nfft, 1./dt)
plt.ylabel('coherence')
plt.show()

.
.
EDIT:

For what it's worth, I've add an answer, maybe it's right, maybe it's wrong. I'm not sure..

Cytoplasm answered 8/2, 2014 at 14:18 Comment(6)
Is the problem that you don't know how to calculate the phase shift from the coherence, or that your code to do so doesn't work? The former is not an on-topic question here.Detoxicate
My problem is that I don't know how to calculate the phase shift from the coherence. It would be very much appreciated in case you can provide me with some hints or advice how to do this (programmatic or mathematical)Cytoplasm
I'm not a Python programmer, but I'm pretty sure you can't. According to the documentation at matplotlib.org/api/mlab_api.html, plt.cohere computes the modulus square of the cross-spectral density normalized by the moduli of the signals, which is why it's purely real-valued. If there is a phase shift between two sinusoidal signals with the same frequency, then the cross-correlation between the signal will be oscillatory and have a phase shift associated with it, and that phase shift will remain after being Fourier transformed, but is then destroyed by taking the modulus.Either
So assuming that it's just doing the discretized version of the absolute value of the formula at en.wikipedia.org/wiki/Spectral_density#Cross-spectral_density, you won't find the phase shift. Is there some reason why you can't just take the FFT's of the two individual signals and use the phase difference taken from that?Either
Just for clarification, when you say "one is responding on the other, but with a certain phase shift", do you mean that you are expecting the two signals to be the same (except for noise), but with a time delay between the two?Either
@DumpsterDoofus, thanks for your clarification. I was hoping to find the phase of the most coherent peaks of the two signals. Using the same principles as here: www2.ocean.washington.edu/flowmow/processing/currents/coh/…Cytoplasm
C
8

Let me try to answer my own question and maybe one day it might be useful to others or function as a starting point for a (new) discussion:

Firstly calculate the power spectral densities of both the signals,

subplot(121)
psd(s1, nfft, 1/dt)
plt.title('signal1')

subplot(122)
psd(s2, nfft, 1/dt)
plt.title('signal2')

plt.tight_layout()
show()

resulting in:enter image description here

Secondly calculate the cross-spectral density, which is Fourier transform of the cross-correlation function:

csdxy, fcsd = plt.csd(s1, s2, nfft, 1./dt)
plt.ylabel('CSD (db)')
plt.title('cross spectral density between signal 1 and 2')
plt.tight_layout()
show()

Which gives:

enter image description here

Than using the cross-spectral density we can calculate the phase and we can calculate the coherence (which will destroy the phase). Now we can combine the coherence and the peaks that rise above the 95% confidence level

# coherence
cxy, fcoh = cohere(s1, s2, nfft, 1./dt)

# calculate 95% confidence level
edof = (len(s1)/(nfft/2)) * cxy.mean() # equivalent degrees of freedom: (length(timeseries)/windowhalfwidth)*mean_coherence
gamma95 = 1.-(0.05)**(1./(edof-1.))
conf95 = np.where(cxy>gamma95)
print 'gamma95',gamma95, 'edof',edof

# Plot twin plot
fig, ax1 = plt.subplots()
# plot on ax1 the coherence
ax1.plot(fcoh, cxy, 'b-')
ax1.set_xlabel('Frequency (hr-1)')
ax1.set_ylim([0,1])
# Make the y-axis label and tick labels match the line color.
ax1.set_ylabel('Coherence', color='b')
for tl in ax1.get_yticklabels():
    tl.set_color('b')

# plot on ax2 the phase
ax2 = ax1.twinx()
ax2.plot(fcoh[conf95], phase[conf95], 'r.')
ax2.set_ylabel('Phase (degrees)', color='r')
ax2.set_ylim([-200,200])
ax2.set_yticklabels([-180,-135,-90,-45,0,45,90,135,180])

for tl in ax2.get_yticklabels():
    tl.set_color('r')

ax1.grid(True)
#ax2.grid(True)
fig.suptitle('Coherence and phase (>95%) between signal 1 and 2', fontsize='12')
plt.show()

result in:

enter image description here

To sum up: the phase of the most coherent peak is ~1 degrees (s1 leads s2) at a 10 min period (assuming dt is a minute measurement) -> (10**-1)/dt

But a specialist signal processing might correct me, because I'm like 60% sure if I've done it right

Cytoplasm answered 10/2, 2014 at 5:33 Comment(0)
C
6

I am not sure, where the phase variable was calculated in the answer of @Mattijn.

You can calculate the phase shift from the angle between the real and the imaginary part of the cross-spectral density.

from matplotlib import mlab

# First create power sectral densities for normalization
(ps1, f) = mlab.psd(s1, Fs=1./dt, scale_by_freq=False)
(ps2, f) = mlab.psd(s2, Fs=1./dt, scale_by_freq=False)
plt.plot(f, ps1)
plt.plot(f, ps2)

# Then calculate cross spectral density
(csd, f) = mlab.csd(s1, s2, NFFT=256, Fs=1./dt,sides='default', scale_by_freq=False)
fig = plt.figure()
ax1 = fig.add_subplot(1, 2, 1)
# Normalize cross spectral absolute values by auto power spectral density
ax1.plot(f, np.absolute(csd)**2 / (ps1 * ps2))
ax2 = fig.add_subplot(1, 2, 2)
angle = np.angle(csd, deg=True)
angle[angle<-90] += 360
ax2.plot(f, angle)

# zoom in on frequency with maximum coherence
ax1.set_xlim(9, 11)
ax1.set_ylim(0, 1e-0)
ax1.set_title("Cross spectral density: Coherence")
ax2.set_xlim(9, 11)
ax2.set_ylim(0, 90)
ax2.set_title("Cross spectral density: Phase angle")

plt.show()

fig = plt.figure()
ax = plt.subplot(111)

ax.plot(f, np.real(csd), label='real')
ax.plot(f, np.imag(csd), label='imag')

ax.legend()
plt.show()

The power spectral density of the two signals to be correlated: The power spectral density of the two signals to be correlated

The coherence and the phase of the two signals (zoomed in to 10 Hz): The coherence and the phase of the two signals (zoomed in to 10 Hz)

And here the real and imaginary(!) part of the cross spectral density: real and imaginary part of the cross spectral density

Chambless answered 27/3, 2015 at 17:32 Comment(3)
np.angle(csd) returns an all zero vector because the cross spectrum is real valued, I guess.Hereditary
@fccoelho: The cross spectral density has complex values. Just execute the sample code and print the values of csd: array([ 1.90723361e-04 +0.00000000e+00j, 1.98803902e-03 +1.75715712e-03j, ...Chambless
You are right. I was looking at the coherence spectrum, by mistake.Hereditary
C
5

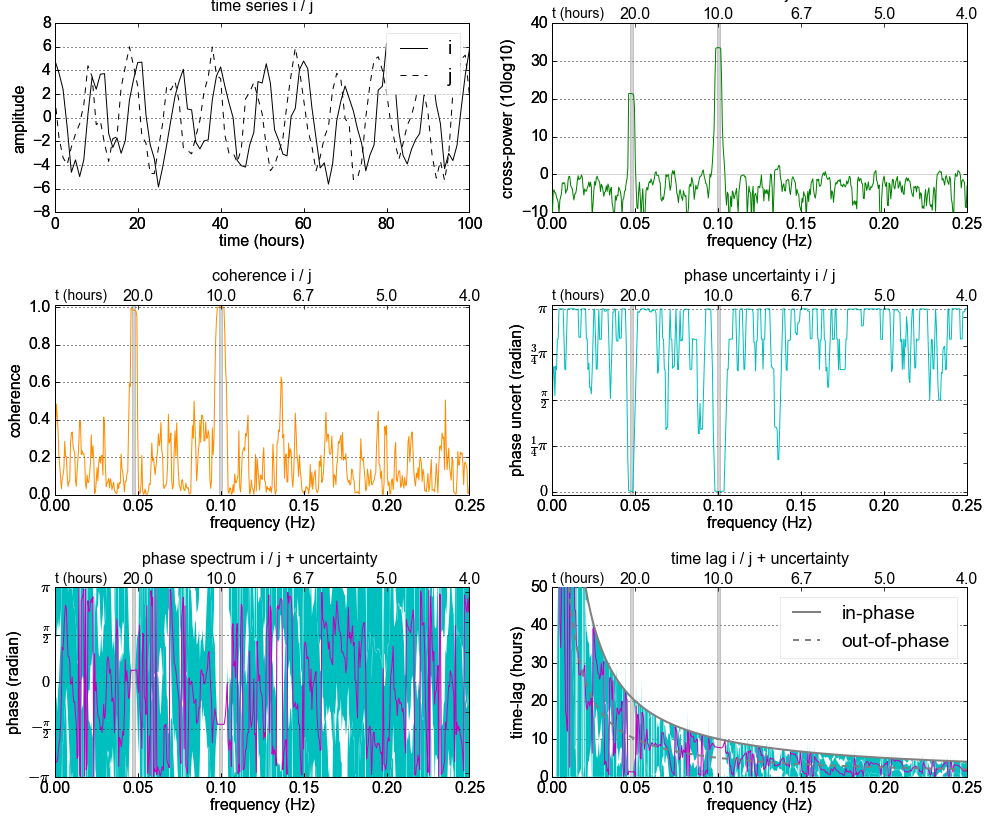
I've prepared a Jupyter Notebook which explains the cross-spectral analysis including its uncertainty.

screenshot: enter image description here

Cytoplasm answered 20/9, 2016 at 6:21 Comment(3)
@KylerBrown it must have been a problem on github servers. For me the link works againCytoplasm
Dear Mattjin, I really enjoyed your solution for the problem. Nevertheless, I got in doubt of one aspect of your model: how to consider sampling frequency units in your model? I could not understand the way that you did to transform from a signal (synthetic from your example) that was theoretically sampled in seconds to a coherence graph that was in hour units. If I were to add some Data to your model that were sampled per month, for example, how should I interpret the labels and legends of your plottings?Leafage
Hi @Mattijn. Thanks for offering this solution. However, could you help provide some insights on how to estimate the uncertainty on the coherence, rather than the phase?Katleen

© 2022 - 2024 — McMap. All rights reserved.