What is 'serviceability memory category' of Native Memory Tracking?
Asked Answered
T

2

16

I have an java app (JDK13) running in a docker container. Recently I moved the app to JDK17 (OpenJDK17) and found a gradual increase of memory usage by docker container.

During investigation I found that the 'serviceability memory category' NMT grows constantly (15mb per an hour). I checked the page https://docs.oracle.com/en/java/javase/17/troubleshoot/diagnostic-tools.html#GUID-5EF7BB07-C903-4EBD-A9C2-EC0E44048D37 but this category is not mentioned there.

Could anyone explain what this serviceability category means and what can cause such gradual increase? Also there are some additional new memory categories comparing to JDK13. Maybe someone knows where I can read details about them.

Here is the result of command jcmd 1 VM.native_memory summary

Native Memory Tracking:

(Omitting categories weighting less than 1KB)

Total: reserved=4431401KB, committed=1191617KB
-                 Java Heap (reserved=2097152KB, committed=479232KB)
                            (mmap: reserved=2097152KB, committed=479232KB) 
 
-                     Class (reserved=1052227KB, committed=22403KB)
                            (classes #29547)
                            (  instance classes #27790, array classes #1757)
                            (malloc=3651KB #79345) 
                            (mmap: reserved=1048576KB, committed=18752KB) 
                            (  Metadata:   )
                            (    reserved=139264KB, committed=130816KB)
                            (    used=130309KB)
                            (    waste=507KB =0.39%)
                            (  Class space:)
                            (    reserved=1048576KB, committed=18752KB)
                            (    used=18149KB)
                            (    waste=603KB =3.21%)
 
-                    Thread (reserved=387638KB, committed=40694KB)
                            (thread #378)
                            (stack: reserved=386548KB, committed=39604KB)
                            (malloc=650KB #2271) 
                            (arena=440KB #752)
 
-                      Code (reserved=253202KB, committed=76734KB)
                            (malloc=5518KB #23715) 
                            (mmap: reserved=247684KB, committed=71216KB) 
 
-                        GC (reserved=152419KB, committed=92391KB)
                            (malloc=40783KB #34817) 
                            (mmap: reserved=111636KB, committed=51608KB) 
 
-                  Compiler (reserved=1506KB, committed=1506KB)
                            (malloc=1342KB #2557) 
                            (arena=165KB #5)
 
-                  Internal (reserved=5579KB, committed=5579KB)
                            (malloc=5543KB #33822) 
                            (mmap: reserved=36KB, committed=36KB) 
 
-                     Other (reserved=231161KB, committed=231161KB)
                            (malloc=231161KB #347) 
 
-                    Symbol (reserved=30558KB, committed=30558KB)
                            (malloc=28887KB #769230) 
                            (arena=1670KB #1)
 
-    Native Memory Tracking (reserved=16412KB, committed=16412KB)
                            (malloc=575KB #8281) 
                            (tracking overhead=15837KB)
 
-        Shared class space (reserved=12288KB, committed=12136KB)
                            (mmap: reserved=12288KB, committed=12136KB) 
 
-               Arena Chunk (reserved=18743KB, committed=18743KB)
                            (malloc=18743KB) 
 
-                   Tracing (reserved=32KB, committed=32KB)
                            (arena=32KB #1)
 
-                   Logging (reserved=7KB, committed=7KB)
                            (malloc=7KB #289) 
 
-                 Arguments (reserved=1KB, committed=1KB)
                            (malloc=1KB #53) 
 
-                    Module (reserved=1045KB, committed=1045KB)
                            (malloc=1045KB #5026) 
 
-                 Safepoint (reserved=8KB, committed=8KB)
                            (mmap: reserved=8KB, committed=8KB) 
 
-           Synchronization (reserved=204KB, committed=204KB)
                            (malloc=204KB #2026) 
 
-            Serviceability (reserved=31187KB, committed=31187KB)
                            (malloc=31187KB #49714) 
 
-                 Metaspace (reserved=140032KB, committed=131584KB)
                            (malloc=768KB #622) 
                            (mmap: reserved=139264KB, committed=130816KB) 
 
-      String Deduplication (reserved=1KB, committed=1KB)
                            (malloc=1KB #8) 

The detailed information about increasing part of memory is:

[0x00007f6ccb970cbe] OopStorage::try_add_block()+0x2e
[0x00007f6ccb97132d] OopStorage::allocate()+0x3d
[0x00007f6ccbb34ee8] StackFrameInfo::StackFrameInfo(javaVFrame*, bool)+0x68
[0x00007f6ccbb35a64] ThreadStackTrace::dump_stack_at_safepoint(int)+0xe4
                             (malloc=6755KB type=Serviceability #10944)

Update#1 from 2022-01-17:

Thanks to @Aleksey Shipilev for help! We were able to find a place which causes the issue, is related to many ThreadMXBean#.dumpAllThreads calls. Here is MCVE, Test.java:

Run with:

java -Xmx512M -XX:NativeMemoryTracking=detail Test.java 

and check periodically serviceability category in result of

jcmd YOUR_PID VM.native_memory summary 

Test java:

import java.lang.management.ManagementFactory;
import java.lang.management.ThreadInfo;
import java.lang.management.ThreadMXBean;
import java.util.concurrent.ExecutorService;
import java.util.concurrent.Executors;
import java.util.concurrent.TimeUnit;

public class Test {

    private static final int RUNNING = 40;
    private static final int WAITING = 460;

    private final Object monitor = new Object();
    private final ThreadMXBean threadMxBean = ManagementFactory.getThreadMXBean();
    private final ExecutorService executorService = Executors.newFixedThreadPool(RUNNING + WAITING);

    void startRunningThread() {
        executorService.submit(() -> {
            while (true) {
            }
        });
    }

    void startWaitingThread() {
        executorService.submit(() -> {
            try {
                monitor.wait();
            } catch (InterruptedException e) {
                e.printStackTrace();
            }
        });
    }

    void startThreads() {
        for (int i = 0; i < RUNNING; i++) {
            startRunningThread();
        }

        for (int i = 0; i < WAITING; i++) {
            startWaitingThread();
        }
    }

    void shutdown() {
        executorService.shutdown();
        try {
            executorService.awaitTermination(5, TimeUnit.SECONDS);
        } catch (InterruptedException e) {
            e.printStackTrace();
        }
    }

    
    public static void main(String[] args) throws InterruptedException {
        Test test = new Test();

        Runtime.getRuntime().addShutdownHook(new Thread(test::shutdown));

        test.startThreads();

        for (int i = 0; i < 12000; i++) {
            ThreadInfo[] threadInfos = test.threadMxBean.dumpAllThreads(false, false);
            System.out.println("ThreadInfos: " + threadInfos.length);

            Thread.sleep(100);
        }

        test.shutdown();
    }
}
Torquemada answered 14/1, 2022 at 11:33 Comment(0)
S
19

Unfortunately (?), the easiest way to know for sure what those categories map to is to look at OpenJDK source code. The NMT tag you are looking for is mtServiceability. This would show that "serviceability" are basically diagnostic interfaces in JDK/JVM: JVMTI, heap dumps, etc.

But the same kind of thing is clear from observing that stack trace sample you are showing mentions ThreadStackTrace::dump_stack_at_safepoint -- that is something that dumps the thread information, for example for jstack, heap dump, etc. If you have a suspicion for the memory leak in that code, you might try to build a MCVE demonstrating it, and submitting the bug against OpenJDK, or showing it to a fellow OpenJDK developer. You probably know better what your application is doing to cause thread dumps, focus there.

That being said, I don't see any obvious memory leaks in StackFrameInfo, neither can I reproduce any leak with stress tests, so maybe what you are seeing is "just" thread dumping over the larger and larger thread stacks. Or you capture it when thread dump is happening. Or... It is hard to say without the MCVE.

Update: After playing with MCVE, I realized that it reproduces with 17.0.1, but not with either mainline development JDK, or JDK 18 EA, or JDK 17.0.2 EA. I tested with 17.0.2 EA before, so was not seeing it, dang. Bisection between 17.0.1 and 17.0.2 EA shows it was fixed with JDK-8273902 backport. 17.0.2 releases this week, so the bug should disappear after you upgrade.

Splasher answered 14/1, 2022 at 15:58 Comment(4)
@Alexey Shipilev thank you for your help! You were right, the serviceability category of NMT memory leak was caused by periodical dumps the thread information. I have added a MCVE in the description of question (section "Update#1 from 2022-01-17"). Do you think it can be considered as a bug of JDK17? It is reproducible on OpenJDK 17.0.1 and OracleJDK 17.0.1 but it works good on OpenJDK 13.0.1Torquemada
Cool, MCVE would be helpful to diagnose this further, let me take a look.Splasher
All right, I amended the answer: it is a bug, and there is a fix that is backported to 17.0.2.Splasher
That's great that it will be fixed in 17.0.2! Many thanks @Alexey Shipilev for your help!Torquemada
D
1

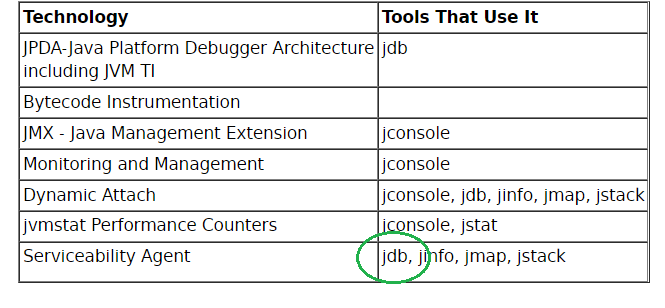
One possible reason for some memory fluctuations would be some other process using dynamic attach to attach on JVM and debug the application and transfer application wise information to the debugger. Serviceability is closely related with jdb (java debugger).

https://openjdk.java.net/groups/serviceability/ enter image description here

The open JDK has this also analytically documented

Serviceability in HotSpot

The HotSpot Virtual Machine contains several technologies that allow its operation >to be observed by another Java process:

The Serviceability Agent(SA). The Serviceability Agent is a Sun private >component in the HotSpot repository that was developed by HotSpot engineers to >assist in debugging HotSpot. They then realized that SA could be used to craft >serviceability tools for end users since it can expose Java objects as well as >HotSpot data structures both in running processes and in core files.

jvmstat performance counters. HotSpot maintains several performance counters >that are exposed to external processes via a Sun private shared memory mechanism. >These counters are sometimes called perfdata.

The Java Virtual Machine Tool Interface (JVM TI). This is a standard C >interface that is the reference implementation of JSR 163 - JavaTM Platform >Profiling Architecture JVM TI is implemented by HotSpot and allows a native code >'agent' to inspect and modify the state of the JVM.

The Monitoring and Management interface. This is a Sun private API that allows >aspects of HotSpot to be monitored and managed.

Dynamic Attach. This is a Sun private mechanism that allows an external process >to start a thread in HotSpot that can then be used to launch an agent to run in >that HotSpot, and to send information about the state of HotSpot back to the >external process.

DTrace. DTrace is the award winning dynamic trace facility built into Solaris >10 and later versions. DTrace probes have been added to HotSpot that allow >monitoring of many aspects of operation when HotSpot runs on Solaris. In addition, >HotSpot contains a jhelper.d file that enables dtrace to show Java frames in stack >traces.

pstack support. pstack is a Solaris utility that prints stack traces of all >threads in a process. HotSpot includes support that allows pstack to show Java >stack frames.

Drinkable answered 14/1, 2022 at 20:39 Comment(0)

© 2022 - 2024 — McMap. All rights reserved.