Debugging Airflow Tasks with IDE tools?
Asked Answered
T

5

16

My Airflow DAGs mainly consist of PythonOperators, and I would like to use my Python IDEs debug tools to develop python "inside" airflow. - I rely on Airflow's database connectors, which I think would be ugly to move "out" of airflow for development.

I have been using Airflow for a bit, and have so far only achieved development and debugging via the CLI. Which is starting to get tiresome.

Does anyone know of a nice way to set up PyCharm, or another IDE, that enables me to use the IDE's debug toolset when running airflow test ..?

Thereat answered 19/11, 2019 at 10:28 Comment(0)
F
13

Might be a little late to the party, but been looking for a solution to this as well. Wanted to be able to debug code as close to "production mode" as possible (so nothing with test etc).

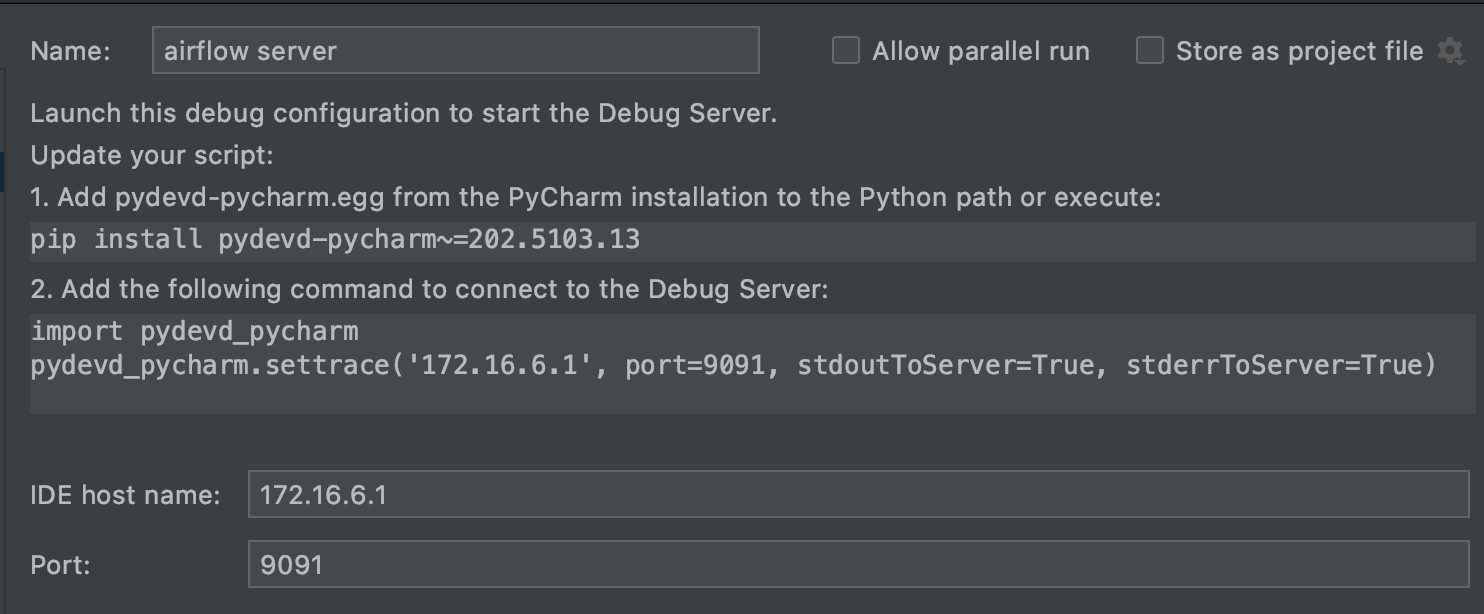
Found a solution in the form of the "Python Debug Server". It works the other way around: Your IDE listens and the connection is made from the remote script to your editor.

Just add a new run configuration of type "Python Debug Server". You'll get a screen telling you to pip install pydevd-pycharm remotely. At that same page you can fill in your local IP and a port on which the debugger should be available and optional path mappings.

After that, just add the proposed 2 lines of code to where you want your debug session to start.

Run the configuration to activate the listener and if all is well your editor should break as soon as the location of the settrace-call is reached.

airflow remote debug

Edit/Note: If you stop the configuration in your editor, airflow will continue with the task, be sure to realise that.

Fuchsin answered 5/6, 2020 at 9:51 Comment(4)
Trying this because it works for my use-case perfectly however I'm constantly getting a socket timeout when trying to remotely run the script from my ec2 instance. (i.e the editor is actively listening, but the connection is never established). Was wondering if you faced a similar issue? Things I've tried: - Pinging my local ip from ec2 instance (Successful - outbound rule for EC2 instance seems to be working) - Modifying the timeout time from 10 to 60 seconds in pydevd_comm.py - Selecting a different range of ports. (Unsuccessful - Doesn't help with the problem)Roughdry
It needs to be able to establish a direct connection to your local machine. Would surprise me if that was possible from an ec2 instance (Usually works within your own LAN only)? Perhaps you could use some kind of tunnel (ngrok or something alike)? Or even port forwarding from your router and using your external IP..Fuchsin
You nailed it and made my year!! Thanks for this. HUGE! I am running a containerized airflow build and simple needed to add pydevd-pycharm~=202.7319.64 to my requirements.txt file for the container then pick an unused port. Works like a charm!Whitleather
For anyone trying this locally from WSL2, there would be some changes required. This is because the PyCharm listens on the port setup on Windows, but the application (airflow) is connecting from WSL2. 1) Allow inbound connections in Windows from WSL2. Run the below in admin powershell: New-NetFirewallRule -DisplayName "WSL" -Direction Inbound -InterfaceAlias "vEthernet (WSL)" -Action Allow 2) Find IP address of Windows as seen by WSL2. Run the below in WSL2: ip route | grep default 3) In PyCharm, when adding the code as a debug point, use IP address found via Step 2.Derwent
T
4

It might be somewhat of a hack, but I found one way to set up PyCharm:

  • Use which airflow to the local airflow environment - which in my case is just a pipenv
  • Add a new run configuration in PyCharm
  • Set the python "Script path" to said airflow script
  • Set Parameters to test a task: test dag_x task_y 2019-11-19

This have only been validated with the SequentialExecutor, which might be important.

It sucks that I have to change test parameters in the run configuration for every new debug/development task, but so far this is pretty useful for setting breakpoints and stepping through code while "inside" the local airflow environment.

Thereat answered 19/11, 2019 at 10:28 Comment(1)
You can also add AIRFLOW__CORE__EXECUTOR=DebugExecutor to your Environment variables field in Pycharm's Run/Debug configuration dialogPalingenesis
B
2

For VSCode, the following debug configuration attaches the builtin debugger

    {
        "name": "Airflow Test - Example",
        "type": "python",
        "request": "launch",
        "program": "`pyenv which airflow`",  // or path to airflow 
        "console": "integratedTerminal",
        "args": [ // exact formulation may depend on airflow 1.0 vs 2.0
            "test",
            "mydag",
            "mytask",
            "`date +%Y-%m-%dT00:00:00`", // current date 
            "-sd",
            "path/to/mydag" // providing the subdirectory makes this faster
        ]
    }

I'd assume there are similar configs that work for other IDEs

Barvick answered 29/10, 2021 at 22:28 Comment(1)
any idea how I can pass a conf to the DAG through the args?Teillo
P
1

I debug airflow test dag_id task_id, run on a vagrant machine, using PyCharm. You should be able to use the same method, even if you're running airflow directly on localhost.

Pycharm's documentation on this subject should show you how to create an appropriate "Python Remote Debug" configuration. When you run this config, it waits to be contacted by the bit of code that you've added someplace (for example in one of your operators). And then you can debug as normal, with breakpoints set in Pycharm.

Pastrami answered 19/11, 2019 at 14:32 Comment(0)
S
1

If you use docker compose and Airflow, the Python Debug Server works the same. Start the containers regularly, create the run configuration and install required package in the docker container (e.g. webserver/scheduler).
The IDE host name that worked for me was host.docker.internal with any unused port. I also connect to the container and run the DAGs like this:

python dags/your_dag.py

DAG file:

dag = ... # generate or create your dag
if __name__ == "__main__":
  import pydevd_pycharm
  pydevd_pycharm.settrace('host.docker.internal', port=9673, stdoutToServer=True, stderrToServer=True)
  dag.test()

Don't forget to create path mappings in the run configuration.

Spirited answered 17/8, 2023 at 17:24 Comment(1)
This worked best for me, just note that you can separate out the pydevd_pycharm stuff into another .py file save it as another fun configuration and set it up as an Add before launch task in the run config. That way you keep your DAG code clean.Squeamish

© 2022 - 2024 — McMap. All rights reserved.