How to debug Azure Web App memory leaks?
Asked Answered
S

5

16

There is the excellent Start Profiling button in the SCM portal that works perfect for CPU.

enter image description here

Then there are some sources that refer to a Download GC Dump button: https://mcmap.net/q/749544/-memory-consumption-net-application-azure-websites

But that doesn't seem to be available anymore.

Then there is the Download memory dump button. But for now I can't figure out how/if I can see the Type / Refcount / Size stastistics that I'm used too.

What is the recommended way to look for memory leaks in a C# Azure Web App?

Sucy answered 16/3, 2016 at 8:55 Comment(0)
B
10

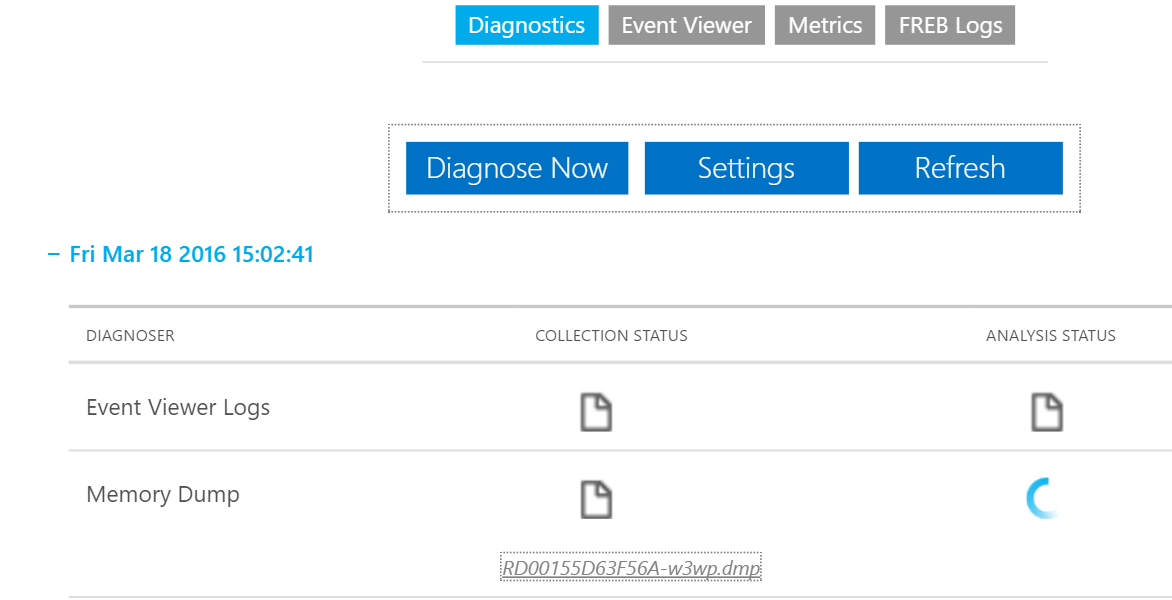
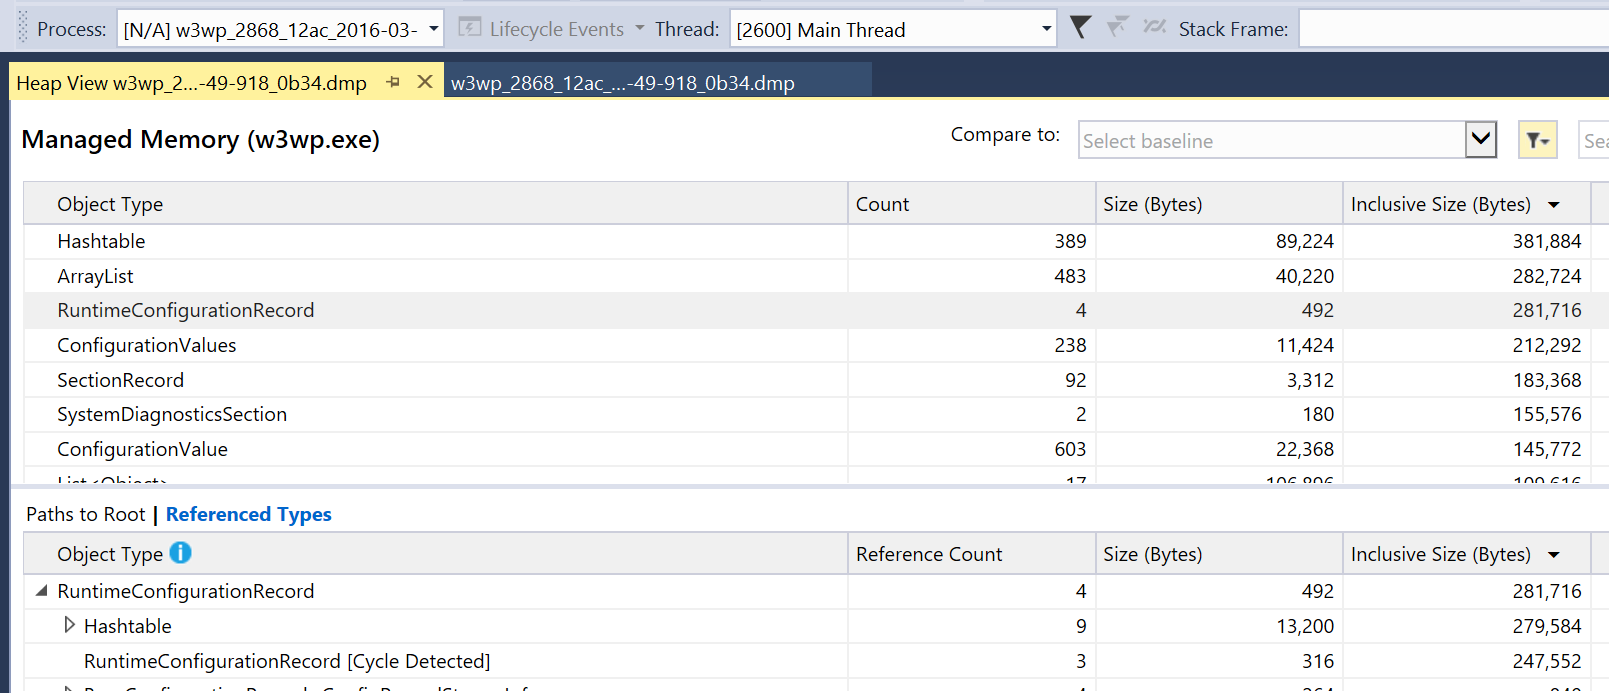
Try using Kudu console. Go to https://[sitename].scm.azurewebsites.net/support Click Analyze -> Dignostics -> Settings. Make sure Memory dumps is checked And then Click Dignose Now. This will work only in Basic plan and above (Not available for free plan) After some time you will get the dump enter image description here Open the downloaded file with Visual studio and select "Debug managed memory". You can then see the details. enter image description here

Betteann answered 18/3, 2016 at 9:35 Comment(3)
Hi @GhandaliSamant, thanks for your answer. When I do this I get Unhandled exception at 0x0000000000000000 in w3wp_39104_8a58_2016-03-16_14-23-22-814_98c0.dmp: 0x80000007: Operation aborted. Any idea?Sucy
Let me try and get back. That didn't happen with me. At what step did you get this error?Betteann
That Kudu support page has been deprecated. Memory dumps can now be obtained in Azure Portal under "Diagnose and solve problems" for a selected website.Moquette
C
13

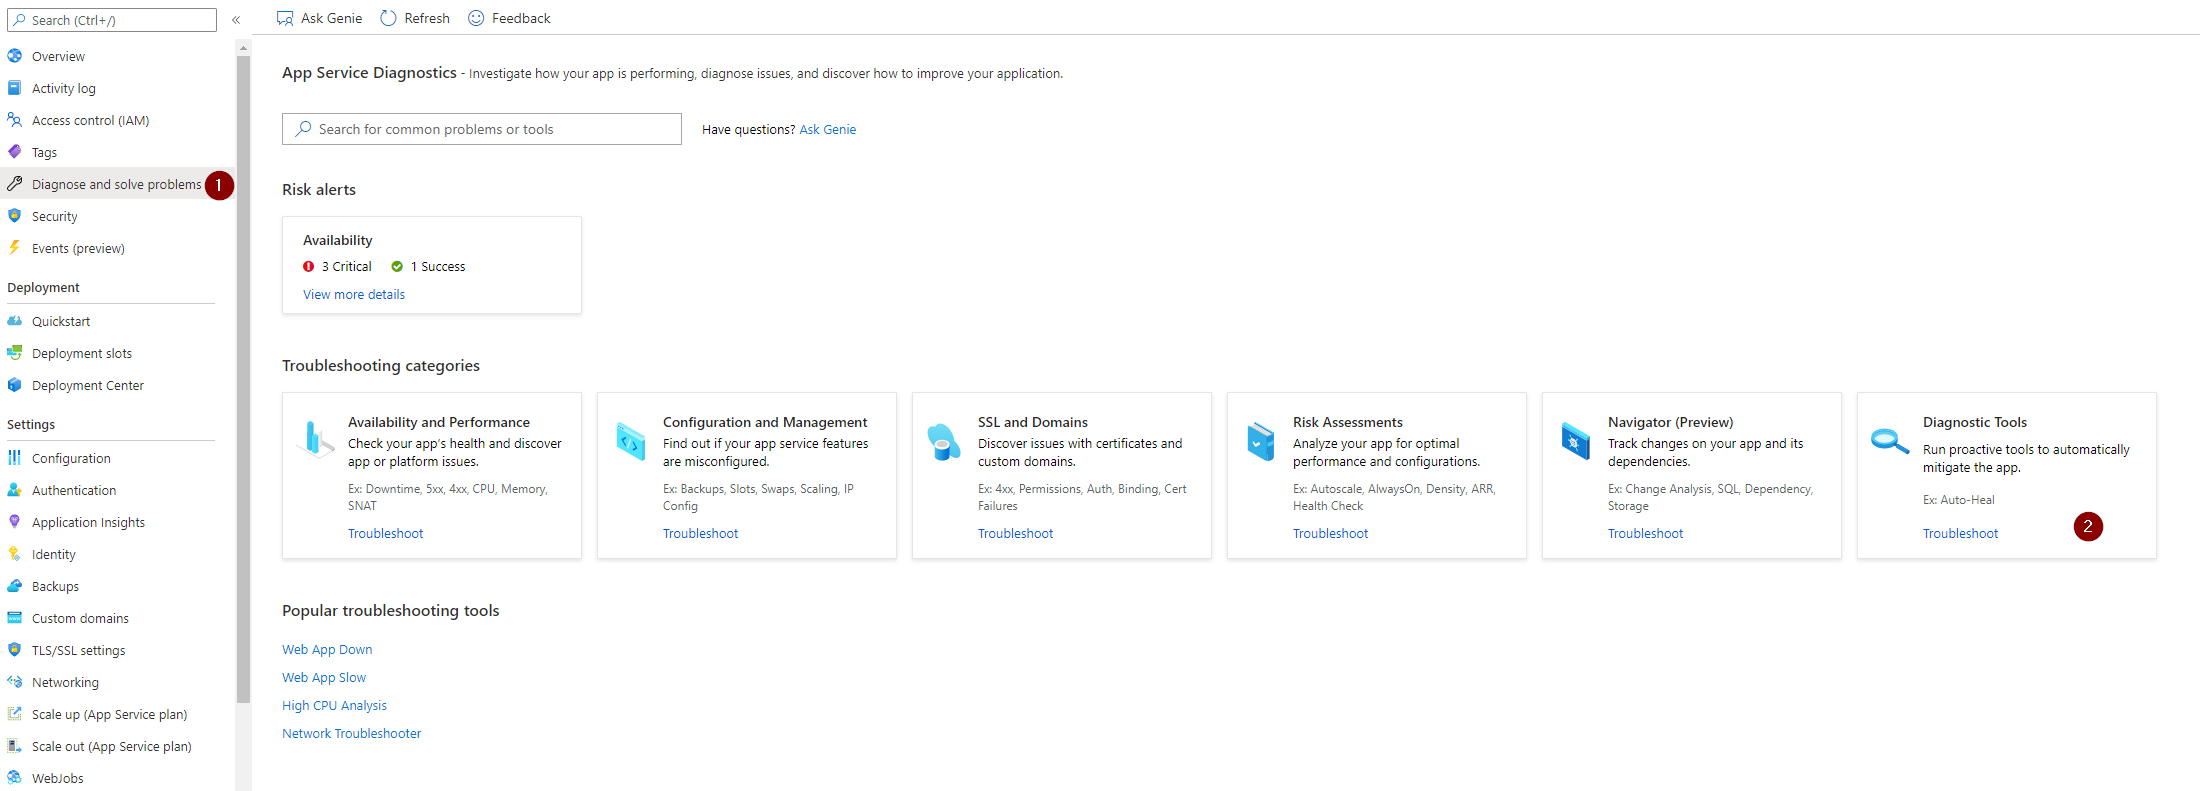
Unfortunately the kudu support page has been deprecated. You can now find it under Diagnose and solve problems: Screenshot of the azure portal

Once you've downloaded the dump files, open them in Visual Studio and click "Collect a memory dump" like the accepted answer from Grandhali suggested.

Candicandia answered 4/7, 2019 at 13:47 Comment(1)
The page gives 2 options , "Collect and Analyze Data" and "Collect Data Only", in first option , it will analyze on live w3wp so there might be some impact on your application if you select ALL instances at oneFlagman
B
10

Try using Kudu console. Go to https://[sitename].scm.azurewebsites.net/support Click Analyze -> Dignostics -> Settings. Make sure Memory dumps is checked And then Click Dignose Now. This will work only in Basic plan and above (Not available for free plan) After some time you will get the dump enter image description here Open the downloaded file with Visual studio and select "Debug managed memory". You can then see the details. enter image description here

Betteann answered 18/3, 2016 at 9:35 Comment(3)
Hi @GhandaliSamant, thanks for your answer. When I do this I get Unhandled exception at 0x0000000000000000 in w3wp_39104_8a58_2016-03-16_14-23-22-814_98c0.dmp: 0x80000007: Operation aborted. Any idea?Sucy
Let me try and get back. That didn't happen with me. At what step did you get this error?Betteann
That Kudu support page has been deprecated. Memory dumps can now be obtained in Azure Portal under "Diagnose and solve problems" for a selected website.Moquette
F
4

I see this thread is pretty old, but since I had the same problem and the azure portal changes a lot during the time I want to post a little update here.

This microsoft dev blog gives a fast overview about the topic: https://devblogs.microsoft.com/premier-developer/collect-and-automate-diagnostic-actions-with-azure-app-services/

I managed to do the memory leak analysis by navigating to my App Service in Azure portal, selecting Diagnose and solve problems and afterwards the Diagnostic Tools tile. Now you should see a Collect Memory Dump tile where you can create your memory dump by configuring a blob storage to save it to.

Afterwards I downloaded the dumps and used Visual Studio to analyze the issues.

Frazer answered 6/8, 2021 at 10:37 Comment(1)
or anyone else know where this is now? When you go to Diagnostic Tools, there is no Collect Memory Dump.Prorate
B
-1

You can download a memory dump using Kudu Console and use DebugDiag to profile it, you can have more than one memory dump, one before the leak happens, one during it and one after, later you can compare and see which objects are growing in size and not getting disposed

Bohlin answered 21/3, 2016 at 16:21 Comment(0)
S
-2

Remote Profiling the Azure Web App from Visual Studio is probably the best option.

https://azure.microsoft.com/en-us/blog/remote-profiling-support-in-azure-app-service/

Subservient answered 16/3, 2016 at 16:19 Comment(2)
Hi Chris, thanks for your answer. That feature works great for CPU, but memory doesn't seem to be supported yet. See also the comment from Hadmi Safa No, CPU profiles are only currently supported.Sucy
Works just for CPU. Memory is not supportedCalif

© 2022 - 2024 — McMap. All rights reserved.