I have been having issues with what seems to be a simple thing to do: grouped boxplots with a continuous x axis.
Here is come minimal data data:
df <- cbind(expand.grid(x=1:10, rep=1:20, fill=c("A", "B")), y=runif(400))
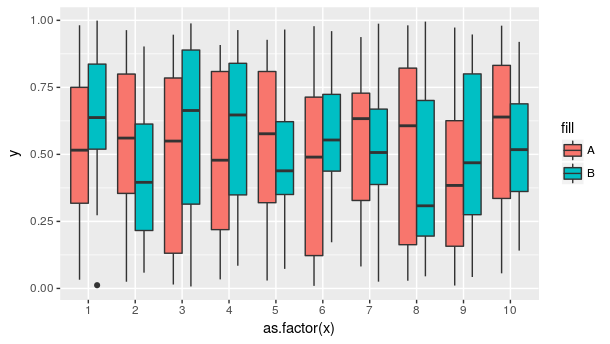
And here is what I want; you will see I have forced the x axis to be discrete:
ggplot(df, aes(x=as.factor(x), y=y, fill=fill)) + geom_boxplot()
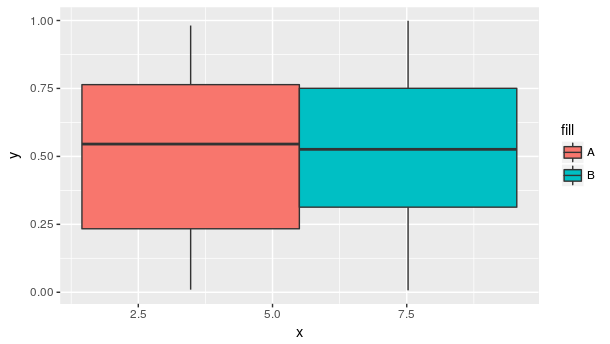
This is what I get when I leave x as continuous, without a grouping:
ggplot(df, aes(x=x, y=y, fill=fill)) + geom_boxplot()
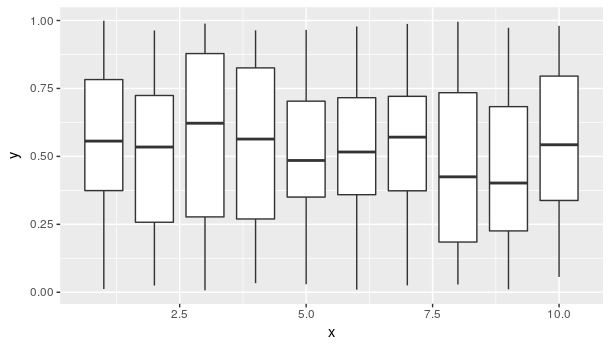
When I add a grouping, the color disappears:
ggplot(df, aes(x=x, y=y, group=x, fill=fill)) + geom_boxplot()
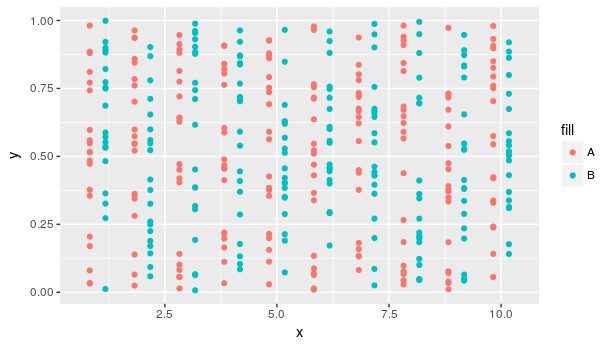
To be clear, what I would want in geom_point would be:
ggplot(df, aes(x=x, y=y, group=x, color=fill)) + geom_point(position=position_dodge(width=.7))
...but if I try to set a dodge in boxplot:
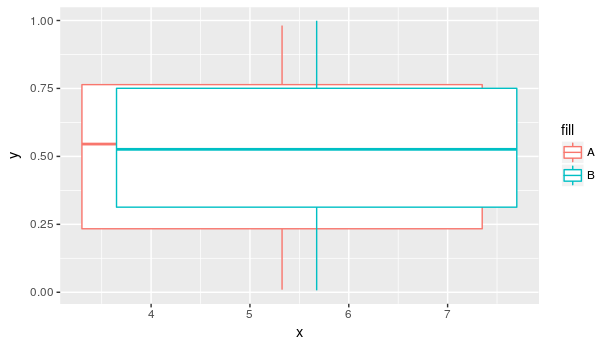
ggplot(df, aes(x=x, y=y, color=fill)) + geom_boxplot(position=position_dodge(width=.7))
Any tips? I have tried searching around: this question addressed continuous boxplots, but without the coloring issue; this question makes me wonder if i need to set an interaction, but doesn't seem to get the desired results. Any help would be hugely appreciated!

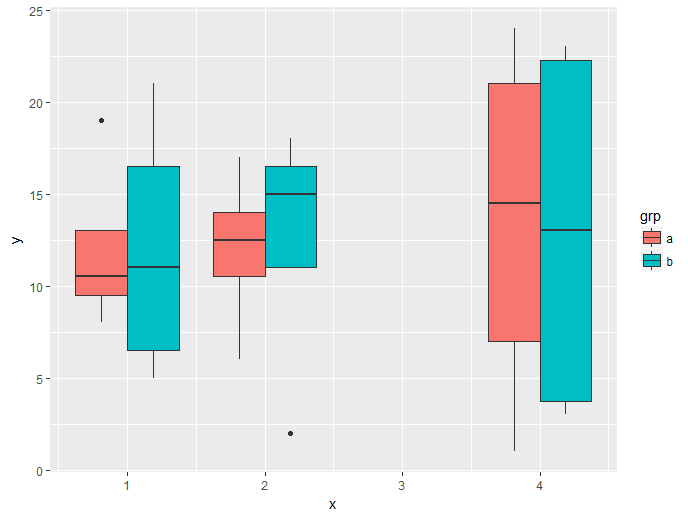

x.ggplot(df, aes(x=cut_interval(x=x, length=1), y=y, fill=fill)) + geom_boxplot()– Shamanism