PySpark: how to resample frequencies
Asked Answered
M

5

16

Imagine a Spark Dataframe consisting of value observations from variables. Each observation has a specific timestamp and those timestamps are not the same between different variables. This is because the timestamp is generated when the value of a variable changed and is recorded.

#Variable     Time                Value
#852-YF-007   2016-05-10 00:00:00 0
#852-YF-007   2016-05-09 23:59:00 0
#852-YF-007   2016-05-09 23:58:00 0

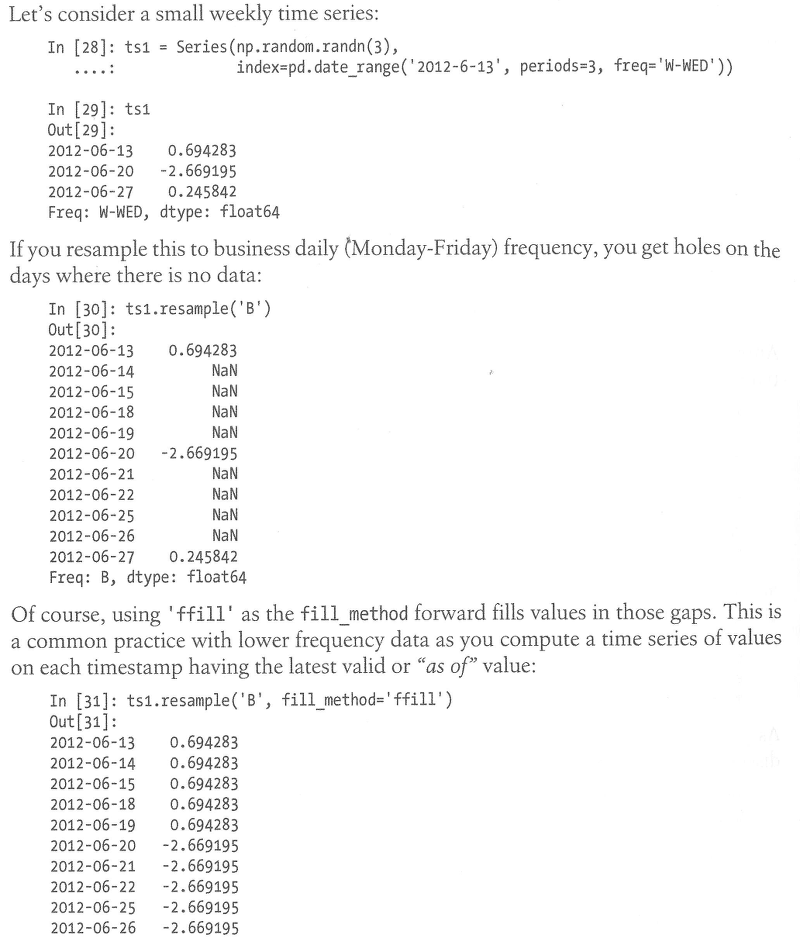
Problem I would like to put all variables into the same frequency (for instance 10min) using forward-fill. To visualize this, I copied a page from the Book "Python for Data Analysis". Question: How to do that on a Spark Dataframe in an efficient way?

Python for Data Analysis

Maleeny answered 1/9, 2016 at 12:17 Comment(0)
E
27

Question: How to do that on a Spark Dataframe in an efficient way?

Spark DataFrame is simply not a good choice for an operation like this one. In general SQL primitives won't be expressive enough and PySpark DataFrame doesn't provide low level access required to implement it.

While re-sampling can be easily represented using epoch / timestamp arithmetics. With data like this:

from pyspark.sql.functions import col, max as max_, min as min_

df = (spark  
    .createDataFrame([
        ("2012-06-13", 0.694), ("2012-06-20", -2.669), ("2012-06-27", 0.245)],   
        ["ts", "val"])        
   .withColumn("ts", col("ts").cast("date").cast("timestamp")))

we can re-sample input:

day = 60 * 60 * 24
epoch = (col("ts").cast("bigint") / day).cast("bigint") * day

with_epoch = df.withColumn("epoch", epoch)

min_epoch, max_epoch = with_epoch.select(min_("epoch"), max_("epoch")).first()

and join with reference:

# Reference range 
ref = spark.range(
    min_epoch, max_epoch + 1, day
).toDF("epoch")

(ref
    .join(with_epoch, "epoch", "left")
    .orderBy("epoch")
    .withColumn("ts_resampled", col("epoch").cast("timestamp"))
    .show(15, False))

## +----------+---------------------+------+---------------------+   
## |epoch     |ts                   |val   |ts_resampled         |
## +----------+---------------------+------+---------------------+
## |1339459200|2012-06-13 00:00:00.0|0.694 |2012-06-12 02:00:00.0|
## |1339545600|null                 |null  |2012-06-13 02:00:00.0|
## |1339632000|null                 |null  |2012-06-14 02:00:00.0|
## |1339718400|null                 |null  |2012-06-15 02:00:00.0|
## |1339804800|null                 |null  |2012-06-16 02:00:00.0|
## |1339891200|null                 |null  |2012-06-17 02:00:00.0|
## |1339977600|null                 |null  |2012-06-18 02:00:00.0|
## |1340064000|2012-06-20 00:00:00.0|-2.669|2012-06-19 02:00:00.0|
## |1340150400|null                 |null  |2012-06-20 02:00:00.0|
## |1340236800|null                 |null  |2012-06-21 02:00:00.0|
## |1340323200|null                 |null  |2012-06-22 02:00:00.0|
## |1340409600|null                 |null  |2012-06-23 02:00:00.0|
## |1340496000|null                 |null  |2012-06-24 02:00:00.0|
## |1340582400|null                 |null  |2012-06-25 02:00:00.0|
## |1340668800|2012-06-27 00:00:00.0|0.245 |2012-06-26 02:00:00.0|
## +----------+---------------------+------+---------------------+

In Spark >= 3.1 replace

col("epoch").cast("timestamp")

with

from pyspark.sql.functions import timestamp_seconds

timestamp_seconds("epoch")

Using low level APIs it is possible to fill data like this as I've shown in my answer to Spark / Scala: forward fill with last observation. Using RDDs we could also avoid shuffling data twice (once for join, once for reordering).

But there is much more important problem here. Spark performs optimally when problem can be reduced to element wise or partition wise computations. While forward fill is the case when it is possible, as far as I am aware this is typically not the case with commonly used time series models and if some operation requires a sequential access then Spark won't provide any benefits at all.

So if you work with series which are large enough to require distributed data structure you'll probably want to aggregate it to some object that can be easily handled by a single machine and then use your favorite non-distributed tool to handle the rest.

If you work with multiple time series where each can be handled in memory then there is of course sparkts, but I know you're already aware of that.

Emmalineemmalyn answered 1/10, 2016 at 19:5 Comment(5)
Hi Zero. Again a very nice detailled answer. Just got one question: how to join the epoch-dataframe and the original one if the timestamps don't match? Imagine var1 has different timestamps than var2 but both should be matched with the epochs.Maleeny
I know your posting for scala-forward-fill. Any chance to do that in PySpark?Maleeny
@Maleeny I need bfill and ffill a group, so using groupby with pandas_udf .Ethanethane
@Emmalineemmalyn Time passed since this answer was given. Did things change?Paymaster
@Emmalineemmalyn once you've re-sampled your data using the join as you described, I don't understand why you can't simply use a window function to back fill or forward fill the missing values ? It seems to me you could order by "ts_resampled" and take max or min of "ts" between current and unbound preceding (ffill) or current and unbound following (bfill). Then join on "ts" to get the missing value. Everything being handled in Spark. Thank you !Alfonsoalfonzo
S
2

I once answered a similar question, it'a bit of a hack but the idea makes sense in your case. Map every value on to a list, then flatten the list vertically.


From: Inserting records in a spark dataframe:

You can generate timestamp ranges, flatten them and select rows

import pyspark.sql.functions as func

from pyspark.sql.types import IntegerType, ArrayType


a=sc.parallelize([[670098928, 50],[670098930, 53], [670098934, 55]])\
.toDF(['timestamp','price'])

f=func.udf(lambda x:range(x,x+5),ArrayType(IntegerType()))

a.withColumn('timestamp',f(a.timestamp))\
.withColumn('timestamp',func.explode(func.col('timestamp')))\
.groupBy('timestamp')\
.agg(func.max(func.col('price')))\
.show()

+---------+----------+
|timestamp|max(price)|
+---------+----------+
|670098928|        50|
|670098929|        50|
|670098930|        53|
|670098931|        53|
|670098932|        53|
|670098933|        53|
|670098934|        55|
|670098935|        55|
|670098936|        55|
|670098937|        55|
|670098938|        55|
+---------+----------+
Sweeny answered 1/9, 2016 at 14:16 Comment(4)
But this is not resampling the frequencies of the timestamps.Maleeny
if you map your first row Row([2012-06-13, 0.694283]) to Row( [2012-06-13, 2012-06-14, 2012-06-15] [0.694283, 0.694283, 0.694283] ) then flatten it you get the first three rows of the second table of your book. I don't know what "resampling the frequencies of the timestamps" means.Sweeny
It means that you got variables with different timestamps. One variable for instance with a value of 5 at 8:10am and value of 7 at 8:14am. A second variable with value 4 at 8:09am and so on. Now you want a dataframe with 1min interval (frequency) starting at 8:10am. So you need timestamps as 8:10, 8:11, 8:12, 8:13, 8:14 and the values for var1 and var2 at those times. Vor var1 this would be 5, 5, 5, 5, 7 and var2 is 4, 4, 4, 4, 4.Maleeny
ok so it works, check my first answer, starting with 3 timestamps [670098928],[670098930], [670098934] you end up with all 11 timestamps between 670098928 and 670098938 each at a separate row. You will have to adapt the rule on the variables but it's doable. Post an example and I'll detail it if you don't get it.Sweeny
G
2

This is an old post, though I recently had to solve this with Spark 3.2. Here's the solution I came up with to both up-sample and down-sample the time-series to obtain exactly one data-point per object and per time period.

Assuming the following input data that we want to re-sample per day. Some variable have several data points per day, some have no data during several days:

from pyspark.sql.types import StructType, StringType, ArrayType, DoubleType, TimestampType
from pyspark.sql.functions import udf, date_trunc, row_number, desc, coalesce, datediff, lead, explode, col, lit
from pyspark.sql import Window, Row
from datetime import datetime, timedelta

df = spark.createDataFrame([
    Row(variable="A", record_ts=datetime.fromisoformat("2021-10-01T03:34:23.000"), value=1.),
    Row(variable="B", record_ts=datetime.fromisoformat("2021-10-01T04:34:23.000"), value=10.),
    Row(variable="C", record_ts=datetime.fromisoformat("2021-10-01T05:34:23.000"), value=100.),

    Row(variable="A", record_ts=datetime.fromisoformat("2021-10-02T01:34:23.000"), value=2.),
    Row(variable="A", record_ts=datetime.fromisoformat("2021-10-02T05:34:23.000"), value=3.),
    Row(variable="C", record_ts=datetime.fromisoformat("2021-10-02T02:34:23.000"), value=200.),
    Row(variable="C", record_ts=datetime.fromisoformat("2021-10-02T05:34:23.000"), value=200.),

    Row(variable="B", record_ts=datetime.fromisoformat("2021-10-04T10:34:23.000"), value=40.),
    Row(variable="B", record_ts=datetime.fromisoformat("2021-10-04T12:34:23.000"), value=42.),
    Row(variable="B", record_ts=datetime.fromisoformat("2021-10-04T14:34:23.000"), value=46.),

    Row(variable="A", record_ts=datetime.fromisoformat("2021-10-05T14:34:23.000"), value=6.),

    Row(variable="A", record_ts=datetime.fromisoformat("2021-10-07T09:34:23.000"), value=7.),
    Row(variable="B", record_ts=datetime.fromisoformat("2021-10-07T08:34:23.000"), value=70.),
    Row(variable="C", record_ts=datetime.fromisoformat("2021-10-07T05:34:23.000"), value=700.),
])

I first need this simple udf which essentially just builds a sequence of timestamps:

@udf(ArrayType(TimestampType()))
def pad_time(count: int, start_time: datetime):
    if repeated_count is None:
        return []
    else:
        return [start_time + timedelta(days=c) for c in range(count)]

Down-sampling can be done with a simple groupBy or partitionBy, keeping max 1 value per variable each day (I chose partitionBy in the example below).

Up-sampling with a "fill-forward" strategy can be done by measuring the size of a time gap between 2 successive rows, and then using this information to call the udf above.

df
    # down-sampling by keeping the last value of each variable each day.
    .withColumn("record_day", date_trunc("DAY", "record_ts"))
    .withColumn("row_num",
                row_number().over(
                    Window.partitionBy("variable", "record_day").orderBy(desc("record_ts"))
                ))
    .where("row_num == 1")

    # up-sampling part 1: counts the number of days to be filled (or 1 for the very last value)
    .withColumn("gap",
                coalesce(
                    datediff(
                          lead("record_day").over(Window.partitionBy("variable").orderBy("record_day")),
                        "record_day"),
                    lit(1))
                )

    .select(
          # up-sampling part 2: just, pad the time axis as dictated by "gap", and the other two fields will be repeated
          explode(pad_time("gap", "record_day")).alias("record_day"),
          "variable",
          "value",
      )
    .orderBy("record_day", "variable")

The results looks like that:

+-------------------+--------+-----+
|         record_day|variable|value|
+-------------------+--------+-----+
|2021-10-01 00:00:00|       A|  1.0|
|2021-10-01 00:00:00|       B| 10.0|
|2021-10-01 00:00:00|       C|100.0|
|2021-10-02 00:00:00|       A|  3.0|
|2021-10-02 00:00:00|       B| 10.0|
|2021-10-02 00:00:00|       C|200.0|
|2021-10-03 00:00:00|       A|  3.0|
|2021-10-03 00:00:00|       B| 10.0|
|2021-10-03 00:00:00|       C|200.0|
|2021-10-04 00:00:00|       A|  3.0|
|2021-10-04 00:00:00|       B| 46.0|
|2021-10-04 00:00:00|       C|200.0|
|2021-10-05 00:00:00|       A|  6.0|
|2021-10-05 00:00:00|       B| 46.0|
|2021-10-05 00:00:00|       C|200.0|
|2021-10-06 00:00:00|       A|  6.0|
|2021-10-06 00:00:00|       B| 46.0|
|2021-10-06 00:00:00|       C|200.0|
|2021-10-07 00:00:00|       A|  7.0|
|2021-10-07 00:00:00|       B| 70.0|
|2021-10-07 00:00:00|       C|700.0|
+-------------------+--------+-----+
Grison answered 20/1, 2022 at 18:42 Comment(0)
Y
2

Since Spark 2.4, you can use sequence built-in function with a window to generate all the timestamps between date of change and next date of change, and then use explode to flatten those timestamps.

If we start with the following dataframe df:

+----------+-------------------+---------+
|variable  |time               |value    |
+----------+-------------------+---------+
|852-YF-007|2012-06-13 00:00:00|0.694283 |
|852-YF-007|2012-06-20 00:00:00|-2.669195|
|852-YF-007|2012-06-27 00:00:00|0.245842 |
+----------+-------------------+---------+

when we use the following code:

from pyspark.sql import Window
from pyspark.sql import functions as F

next_start_time = F.lead('time').over(Window.partitionBy('variable').orderBy('time'))
end_time = F.when(next_start_time.isNull(),
                  F.col('time')
           ).otherwise(
                  F.date_sub(next_start_time, 1)
           )

result = df.withColumn('start', F.col('time')) \
    .withColumn('stop', end_time) \
    .withColumn('time', F.explode(F.sequence(
      F.col('start'), F.col('stop'), F.expr("INTERVAL 1 DAY"))
    )) \
    .drop('start', 'stop')

You get the following result dataframe:

+----------+-------------------+---------+
|variable  |time               |value    |
+----------+-------------------+---------+
|852-YF-007|2012-06-13 00:00:00|0.694283 |
|852-YF-007|2012-06-14 00:00:00|0.694283 |
|852-YF-007|2012-06-15 00:00:00|0.694283 |
|852-YF-007|2012-06-16 00:00:00|0.694283 |
|852-YF-007|2012-06-17 00:00:00|0.694283 |
|852-YF-007|2012-06-18 00:00:00|0.694283 |
|852-YF-007|2012-06-19 00:00:00|0.694283 |
|852-YF-007|2012-06-20 00:00:00|-2.669195|
|852-YF-007|2012-06-21 00:00:00|-2.669195|
|852-YF-007|2012-06-22 00:00:00|-2.669195|
|852-YF-007|2012-06-23 00:00:00|-2.669195|
|852-YF-007|2012-06-24 00:00:00|-2.669195|
|852-YF-007|2012-06-25 00:00:00|-2.669195|
|852-YF-007|2012-06-26 00:00:00|-2.669195|
|852-YF-007|2012-06-27 00:00:00|0.245842 |
+----------+-------------------+---------+
Yellowbird answered 23/11, 2022 at 16:51 Comment(0)
F
2

It is 2023, and maybe this approach was still unavailable when others proposed a solution.

I solved this problem using the tempo library from Databricks lab. It turned out to be also faster than other approaches I tried.

from tempo import *
interpolation_frequency = "1 minute"
input_tsdf = TSDF(
                df,
                partition_cols=["part1_col", "part2_col"],
                ts_col="date_time_col",
            )
interpolated_df = input_tsdf.resample(freq=interpolation_frequency, func="mean").interpolate(
        method="ffill")

# show result
display(interpolated_df.df)
Fiction answered 6/7, 2023 at 11:44 Comment(0)

© 2022 - 2024 — McMap. All rights reserved.