Using SVD to compress an image in MATLAB
Asked Answered
A

4

16

I am brand new to MATLAB but am trying to do some image compression code for grayscale images.

Questions

How can I use SVD to trim off low-valued eigenvalues to reconstruct a compressed image?

Work/Attempts so far

My code so far is:

B=imread('images1.jpeg');   
B=rgb2gray(B);  
doubleB=double(B);  
%read the image and store it as matrix B, convert the image to a grayscale
photo and convert the matrix to a class 'double' for values 0-255  
[U,S,V]=svd(doubleB);

This allows me to successfully decompose the image matrix with eigenvalues stored in variable S.

How do I truncate S (which is 167x301, class double)? Let's say of the 167 eigenvalues I want to take only the top 100 (or any n really), how do I do that and reconstruct the compressed image?

Updated code/thoughts

Instead of putting a bunch of code in the comments section, this is the current draft I have. I have been able to successfully create the compressed image by manually changing N, but I would like to do 2 additional things:

1- Show a pannel of images for various compressions (i/e, run a loop for N = 5,10,25, etc.)

2- Somehow calculate the difference (error) between each image and the original and graph it.

I am horrible with understanding loops and output, but this is what I have tried:

B=imread('images1.jpeg');  
B=rgb2gray(B);  
doubleB=im2double(B);%  
%read the image and store it as matrix B, convert the image to a grayscale  
%photo and convert the image to a class 'double'  
[U,S,V]=svd(doubleB);   
C=S;  
for N=[5,10,25,50,100]  
C(N+1:end,:)=0;  
C(:,N+1:end)=0;  
D=U*C*V';  
%Use singular value decomposition on the image doubleB, create a new matrix  
%C (for Compression diagonal) and zero out all entries above N, (which in  
%this case is 100). Then construct a new image, D, by using the new  
%diagonal matrix C.  
imshow(D);  
error=C-D;  
end

Obviously there are some errors because I don't get multiple pictures or know how to "graph" the error matrix

Aceous answered 28/11, 2012 at 21:39 Comment(1)
Some more information at DSP: dsp.stackexchange.com/questions/18673/….Recurved
P
12

Just to start, I assume you're aware that the SVD is really not the best tool to decorrelate the pixels in a single image. But it is good practice.

OK, so we know that B = U*S*V'. And we know S is diagonal, and sorted by magnitude. So by using only the top few values of S, you'll get an approximation of your image. Let's say C=U*S2*V', where S2 is your modified S. The sizes of U and V haven't changed, so the easiest thing to do for now is to zero the elements of S that you don't want to use, and run the reconstruction. (Easiest way to do this: S2=S; S2(N+1:end, :) = 0; S2(:, N+1:end) = 0;).

Now for the compression part. U is full, and so is V, so no matter what happens to S2, your data volume doesn't change. But look at what happens to U*S2. (Plot the image). If you kept N singular values in S2, then only the first N rows of S2 are nonzero. Compression! Except you still have to deal with V. You can't use the same trick after you've already done (U*S2), since more of U*S2 is nonzero than S2 was by itself. How can we use S2 on both sides? Well, it's diagonal, so use D=sqrt(S2), and now C=U*D*D*V'. So now U*D has only N nonzero rows, and D*V' has only N nonzero columns. Transmit only those quantities, and you can reconstruct C, which is approximately like B.

Petrosal answered 28/11, 2012 at 22:14 Comment(6)
thank you for the thorough explanation. I will take a look at this and come back if I have questions/problems.Aceous
currently this is the code I'm using: B=imread('images1.jpeg'); B=rgb2gray(B); doubleB=double(B); [U,S,V]=svd(doubleB); C=S; N=100; C(N+1:end,:)=0; C(:,N+1:end)=0; D=U*C*V'; imshow(D); and no matter what I make N, it seems that the new image is the same (and extremely sketchy looking). For reference, S is 167x301. What am I doing wrong?Aceous
hmm, actually, when I run imshow(doubleB) the image is just awful looking...looks nothing like the originalAceous
Try im2double(B) instead of double(B)Petrosal
I just added some additional code and thoughts to the original post. Having trouble understanding how to output the image from a loop (changing N) and graphing the difference/error between compressed and original.Aceous
Look into subplot for showing multiple images. And try imagesc instead of image to display the error image. And/or square and average the pixels error image to get a single error metric (mean-squared-error) for each reconstruction. Stash that metric in another vector, so you can plot N vs. MSE.Petrosal
B
21

Although this question is old, it has helped me a lot to understand SVD. I have modified the code you have written in your question to make it work.

I believe you might have solved the problem, however just for the future reference for anyone visiting this page, I am including the complete code here with the output images and graph.

Below is the code:

close all
clear all
clc

%reading and converting the image
inImage=imread('fruits.jpg');
inImage=rgb2gray(inImage);
inImageD=double(inImage);

% decomposing the image using singular value decomposition
[U,S,V]=svd(inImageD);

% Using different number of singular values (diagonal of S) to compress and
% reconstruct the image
dispEr = [];
numSVals = [];
for N=5:25:300
    % store the singular values in a temporary var
    C = S;

    % discard the diagonal values not required for compression
    C(N+1:end,:)=0;
    C(:,N+1:end)=0;

    % Construct an Image using the selected singular values
    D=U*C*V';


    % display and compute error
    figure;
    buffer = sprintf('Image output using %d singular values', N)
    imshow(uint8(D));
    title(buffer);
    error=sum(sum((inImageD-D).^2));

    % store vals for display
    dispEr = [dispEr; error];
    numSVals = [numSVals; N];
end

% dislay the error graph
figure; 
title('Error in compression');
plot(numSVals, dispEr);
grid on
xlabel('Number of Singular Values used');
ylabel('Error between compress and original image');

Applying this to the following image: Original Image

Gives the following result with only first 5 Singular Values,

First 5 Singular Values

with first 30 Singular Values,

First 30 Singular Values

and the first 55 Singular Values,

First 55 Singular Values

The change in error with increasing number of singular values can be seen in the graph below.

Error graph

Here you can notice the graph is showing that using approximately 200 first singular values yields to approximately zero error.

Brazier answered 16/7, 2013 at 12:26 Comment(0)
P
12

Just to start, I assume you're aware that the SVD is really not the best tool to decorrelate the pixels in a single image. But it is good practice.

OK, so we know that B = U*S*V'. And we know S is diagonal, and sorted by magnitude. So by using only the top few values of S, you'll get an approximation of your image. Let's say C=U*S2*V', where S2 is your modified S. The sizes of U and V haven't changed, so the easiest thing to do for now is to zero the elements of S that you don't want to use, and run the reconstruction. (Easiest way to do this: S2=S; S2(N+1:end, :) = 0; S2(:, N+1:end) = 0;).

Now for the compression part. U is full, and so is V, so no matter what happens to S2, your data volume doesn't change. But look at what happens to U*S2. (Plot the image). If you kept N singular values in S2, then only the first N rows of S2 are nonzero. Compression! Except you still have to deal with V. You can't use the same trick after you've already done (U*S2), since more of U*S2 is nonzero than S2 was by itself. How can we use S2 on both sides? Well, it's diagonal, so use D=sqrt(S2), and now C=U*D*D*V'. So now U*D has only N nonzero rows, and D*V' has only N nonzero columns. Transmit only those quantities, and you can reconstruct C, which is approximately like B.

Petrosal answered 28/11, 2012 at 22:14 Comment(6)
thank you for the thorough explanation. I will take a look at this and come back if I have questions/problems.Aceous
currently this is the code I'm using: B=imread('images1.jpeg'); B=rgb2gray(B); doubleB=double(B); [U,S,V]=svd(doubleB); C=S; N=100; C(N+1:end,:)=0; C(:,N+1:end)=0; D=U*C*V'; imshow(D); and no matter what I make N, it seems that the new image is the same (and extremely sketchy looking). For reference, S is 167x301. What am I doing wrong?Aceous
hmm, actually, when I run imshow(doubleB) the image is just awful looking...looks nothing like the originalAceous
Try im2double(B) instead of double(B)Petrosal
I just added some additional code and thoughts to the original post. Having trouble understanding how to output the image from a loop (changing N) and graphing the difference/error between compressed and original.Aceous
Look into subplot for showing multiple images. And try imagesc instead of image to display the error image. And/or square and average the pixels error image to get a single error metric (mean-squared-error) for each reconstruction. Stash that metric in another vector, so you can plot N vs. MSE.Petrosal
B
5

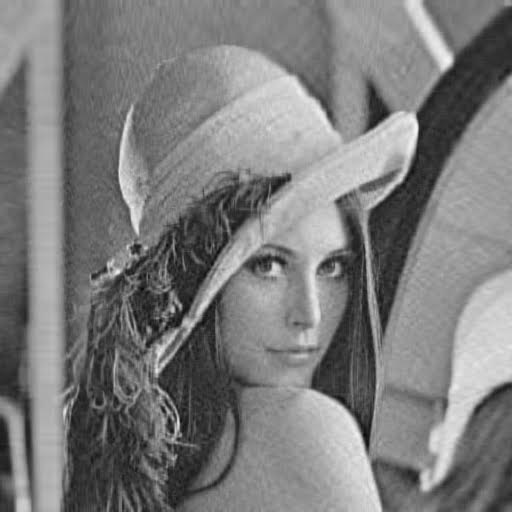
For example, here's a 512 x 512 B&W image of Lena:

Lena

We compute the SVD of Lena. Choosing the singular values above 1% of the maximum singular value, we are left with just 53 singular values. Reconstructing Lena with these singular values and the corresponding (left and right) singular vectors, we obtain a low-rank approximation of Lena:

enter image description here

Instead of storing 512 * 512 = 262144 values (each taking 8 bits), we can store 2 x (512 x 53) + 53 = 54325 values, which is approximately 20% of the original size. This is one example of how SVD can be used to do lossy image compression.


Here's the MATLAB code:

% open Lena image and convert from uint8 to double
Lena = double(imread('LenaBW.bmp'));

% perform SVD on Lena
[U,S,V] = svd(Lena);

% extract singular values
singvals = diag(S);

% find out where to truncate the U, S, V matrices
indices = find(singvals >= 0.01 * singvals(1));

% reduce SVD matrices
U_red = U(:,indices);
S_red = S(indices,indices);
V_red = V(:,indices);

% construct low-rank approximation of Lena
Lena_red = U_red * S_red * V_red';

% print results to command window
r = num2str(length(indices));
m = num2str(length(singvals));
disp(['Low-rank approximation used ',r,' of ',m,' singular values']);

% save reduced Lena
imwrite(uint8(Lena_red),'Reduced Lena.bmp');
Brunet answered 14/10, 2016 at 15:12 Comment(0)
E
0

taking the first n max number of eigenvalues and their corresponding eigenvectors may solve your problem.For PCA, the original data multiplied by the first ascending eigenvectors will construct your image by n x d where d represents the number of eigenvectors.

Ernestineernesto answered 28/11, 2012 at 21:46 Comment(0)

© 2022 - 2024 — McMap. All rights reserved.