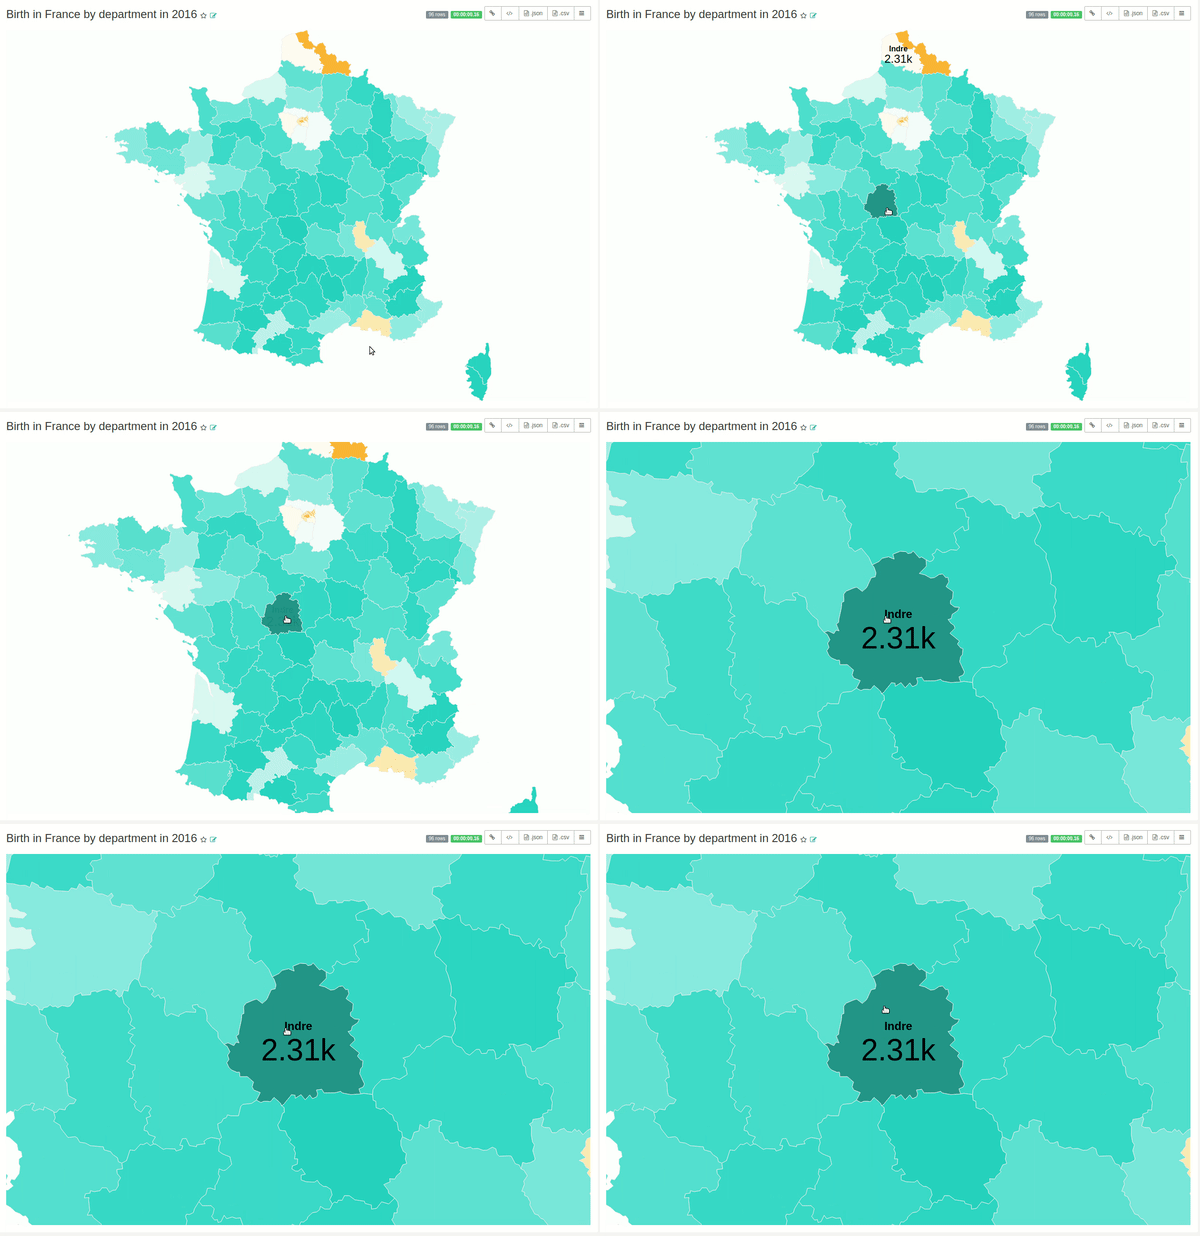
I am using country_map in apache-superset for visualization purposes. When zooming in on a polygon, information from the columns appears inside of the polygon, like so:
There is only one available metric option to display:

Code for the metric update is found on this path:
superset/assets/src/visualizations/CountryMap/CountryMap.js
Code:
const updateMetrics = function (region) {
  if (region.length > 0) {
    resultText.text(format(region[0].metric));
  }
};
The metrics are defined in controls.jsx:
/superset/static/assets/src/explore/controls.jsx
const metrics = {
  type: 'MetricsControl',
  multi: true,
  label: t('Metrics'),
  validators: [v.nonEmpty],
  default: (c) => {
    const metric = mainMetric(c.savedMetrics);
    return metric ? [metric] : null;
  },
  mapStateToProps: (state) => {
    const datasource = state.datasource;
    return {
      columns: datasource ? datasource.columns : [],
      savedMetrics: datasource ? datasource.metrics : [],
      datasourceType: datasource && datasource.type,
    };
  },
  description: t('One or many metrics to display'),
};
const metric = {
  ...metrics,
  multi: false,
  label: t('Metric'),
  default: props => mainMetric(props.savedMetrics),
};
Country map is using metric, which doesn't allow multiple metrics to be selected, Code found here:
superset/assets/src/explore/controlPanels/CountryMap.js
  controlPanelSections: [
    {
      label: t('Query'),
      expanded: true,
      controlSetRows: [
        ['entity'],
        ['metric'],
        ['adhoc_filters'],
      ],
    },
    {
      label: t('Options'),
      expanded: true,
      controlSetRows: [
        ['select_country', 'number_format'],
        ['linear_color_scheme'],
      ],
    },
  ],
The python class of country_map is located at viz.py:
class CountryMapViz(BaseViz):

    """A country centric"""

    viz_type = 'country_map'
    verbose_name = _('Country Map')
    is_timeseries = False
    credits = 'From bl.ocks.org By john-guerra'

    def query_obj(self):
        qry = super(CountryMapViz, self).query_obj()
        qry['metrics'] = [
            self.form_data['metric']]
        qry['groupby'] = [self.form_data['entity']]
        return qry
Changing the code in CountryMap.js and viz.py from metric to metrics results in the following error:
Traceback (most recent call last):
  File "/Documents/superset/superset/superset/viz.py", line 410, in get_df_payload
    df = self.get_df(query_obj)
  File "/Documents/superset/superset/superset/viz.py", line 213, in get_df
    self.results = self.datasource.query(query_obj)
  File "/Documents/superset/superset/superset/connectors/sqla/models.py", line 797, in query
    sql = self.get_query_str(query_obj)
  File "/Documents/superset/superset/superset/connectors/sqla/models.py", line 471, in get_query_str
    qry = self.get_sqla_query(**query_obj)
  File "/Documents/superset/superset/superset/connectors/sqla/models.py", line 585, in get_sqla_query
    elif m in metrics_dict:
TypeError: unhashable type: 'list'
How can I add more metrics to display inside the polygon?


CountryMap.jsandviz.py? – WestbergCountryMap.jsI changed['metric']to['metrics']. I did the same inviz.py, at theCountryMapVizclass, where I just modifiedself.form_data['metric']]toself.form_data['metrics']], in thequery_obj(self)method. – Inceptive