3-D Cartesian points to 2-D hemispherical and calculate the area of 2-D Voronoi cells
Asked Answered
K

1

17

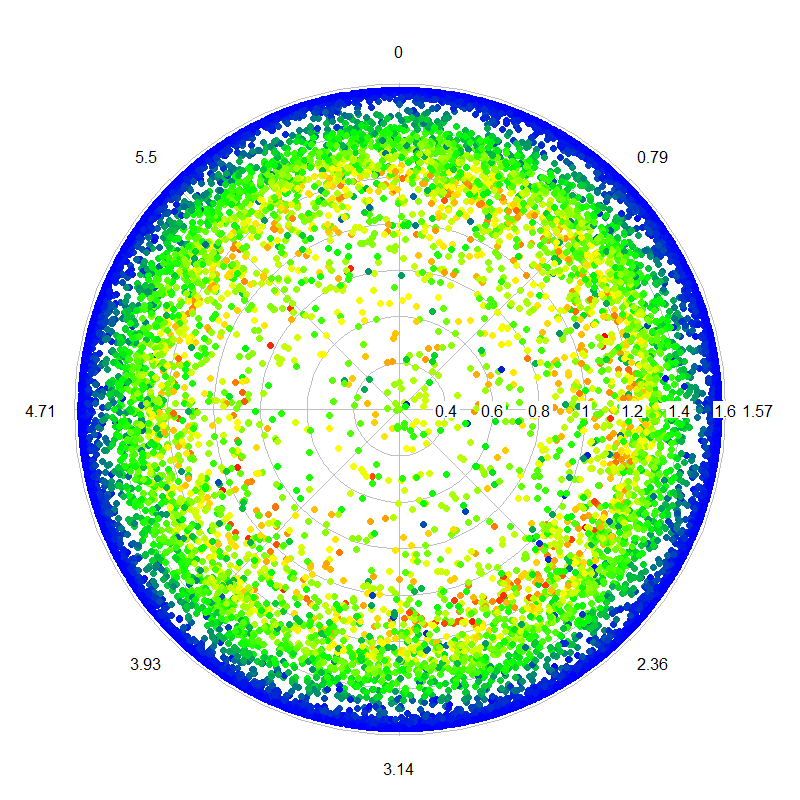
I've been working on some functions in R and MatLab based on Qhull (the geometry package in R) to project local Cartesian X,Y,Z points within a circular plot to spherical (theta,phi,R), centered at 0,0,0. Since all of the Z values are positive in the original coordinates (X and Y are instead centered at 0), this gives me the hemispherical projection that I desire (the point colors are scaled by Z values), plotted with the radial.plot() function of R plotrix, using phi (azimuth angle) and theta (polar angle):

Hemispherical projection of 3-D Cartesian points

For the spherical transformation, after centering at 0,0,0, rather than using the calculations of Bourke (1996), I use the ISO specification listed on Wikipedia (not the physics convention).

r     <- sqrt(x^2 + y^2 + z^2)
theta <- acos(z/r)
phi   <- atan2(y,x)

I would like to know the area of Voronoi cells containing points of a given class in this hemispherical projection, preserving perspective distortion. While it is simple to calculate the 2-D Voronoi diagram for the 2-D Cartesian X,Y points, translating this Voronoi diagram to 2-D spherical may not produce the desired results, yes? Perhaps it would be best to compute the Voronoi diagram directly from the hemispherical projected points and then return the area of each cell.

Update: I've solved it. My solution will be shared in a new R package, which I will post here.

Kutch answered 13/12, 2015 at 20:0 Comment(4)
I don't understand this statement : "I would like to know the area of Voronoi cells containing points in this hemispherical projection". Aren't Voronoï Diagrams defined so that each point belongs to a signle cell and vice versa?Lehmbruck
@Bill Thanks for pointing that out. I've edited it accordingly.Kutch
Could you please clarify: Do you need the area of a Voronoi cell that exists on the hemisphere's surface? Otherwise, I cannot see any projection (that would, e.g., reduce volume data to area data), only a coordinate transformation. But in this case, you would get 3D Voronoi cells with a certain volume rather than an area as in the 2D case. Thank you.Niello
@Adam Could you please post an answer with your solution, so that you can accept it and the question no longer appears in the 'unanswered' list? ThxSetose
B
2

OP, Adam Erickson, published the gapfraction package which implements Erickson's hemispherical-Voronoi gap fraction algorithm.

The gapfraction package for R was designed for modeling understory light in forests with light-detection-and-ranging (LiDAR) data. In addition to metrics of canopy gap fraction (Po), angular canopy closure (ACC), and vertical canopy cover (VCC), the package implements a new canopy height model (CHM) algorithm, popular individual tree crown (ITC) detection algorithms, and a number of other algorithms that produce useful features for statistical modeling, including the distance of trees from plot center.

For further details please consult: gapfraction: R functions for LiDAR canopy light transmission

Please see some simple demonstration of the code below:

# devtools::install_github("adam-erickson/gapfraction", dependencies=TRUE)
library(raster)
library(gapfraction)
data(las)

# This function implements Erickson's hemispherical-Voronoi gap fraction algorithm 
# with four common lens geometries: equi-distant, equi-angular, stereographic, and orthographic

P.hv(
  las = las, 
  model = "equidist", 
  thresh.val = 1.25, 
  thresh.var = "height", 
  reprojection = NA,
  pol.deg = 5,
  azi.deg = 45,
  col = "height", 
  plots = TRUE, 
  plots.each = FALSE, 
  plots.save= FALSE
)

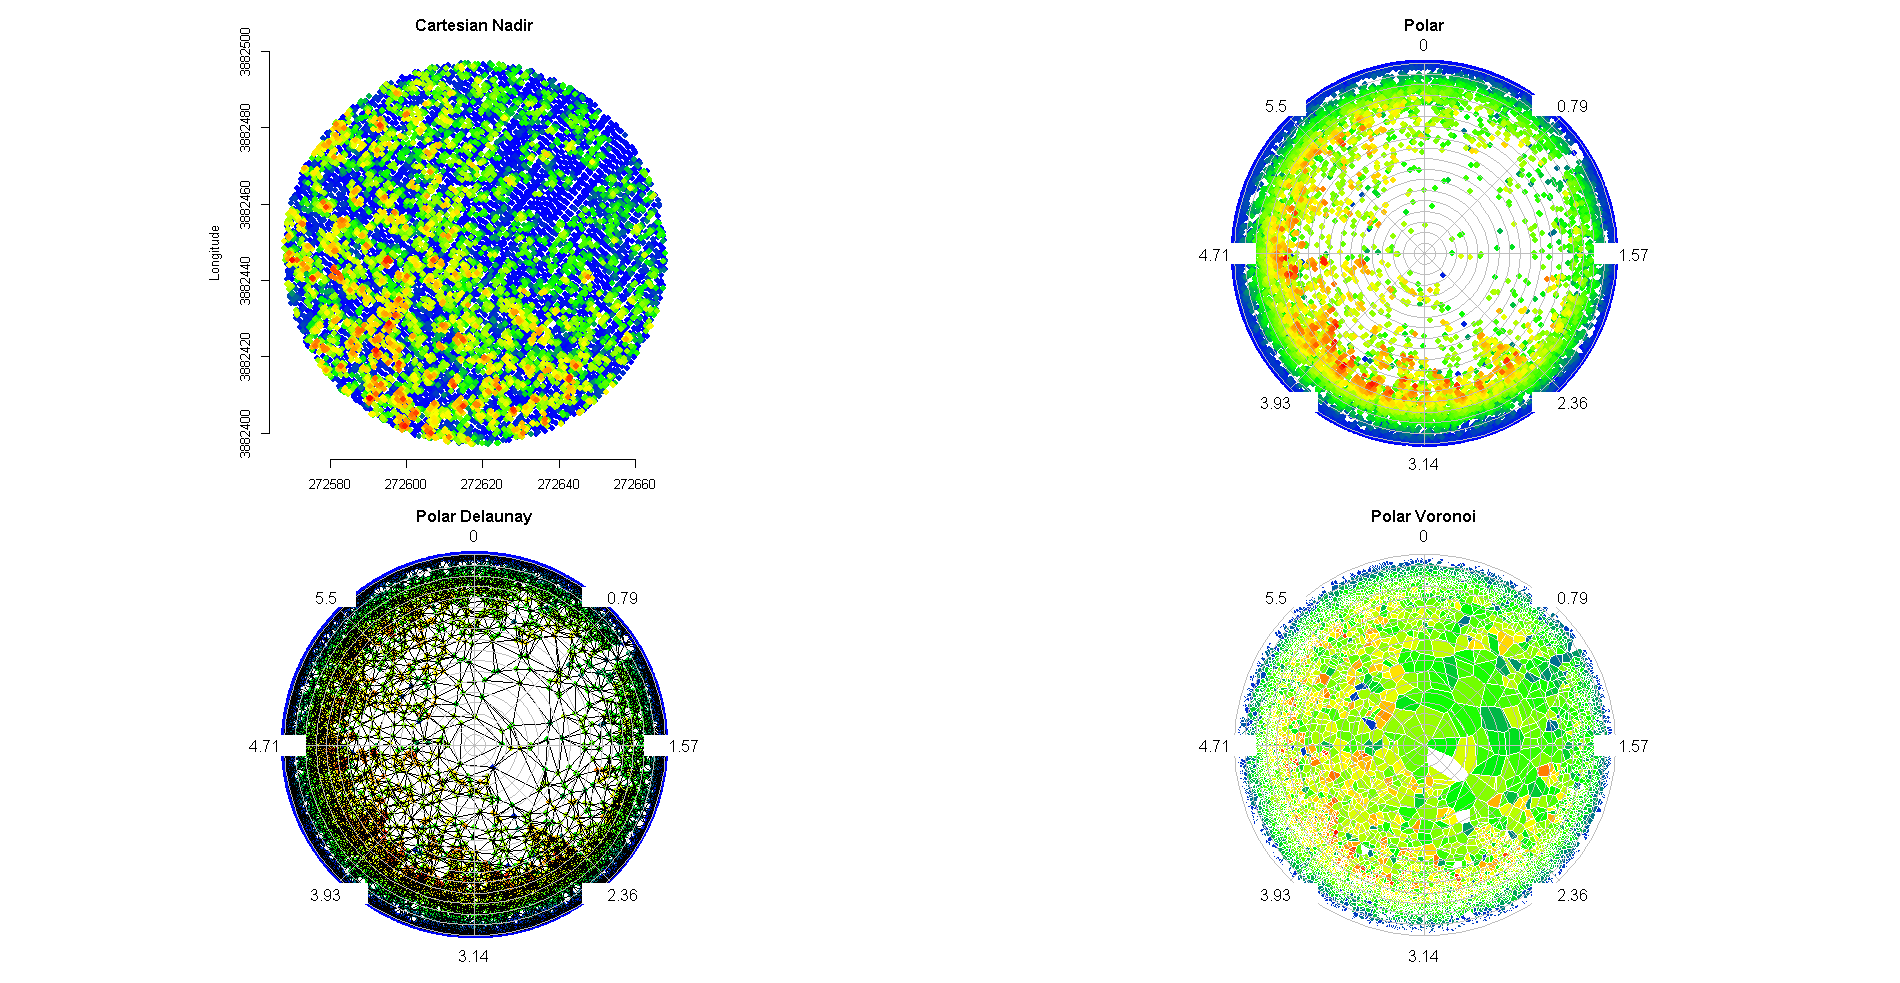
Output: graph

Befoul answered 26/9, 2018 at 15:14 Comment(0)

© 2022 - 2024 — McMap. All rights reserved.