Though might be late for the op, this is still a valid problem.
While it might look like you are debugging the code that you have written, that is simply not the case.
The reason is that your code was minified and uglified by webpack (and probably transpiled by babel). The compiled code is what gets executed by the browser, which then maps it through source maps to your source code.
Browsers do their best to make this experience as seamless as possible. In most cases, you won't even notice the illusion but in other cases, it might confuse you. Since the variables and module imports are renamed during the uglification process, they are no longer available by their original name in the console.
So in order to find out the value of an imported module, you would have to observe the compiled variable.
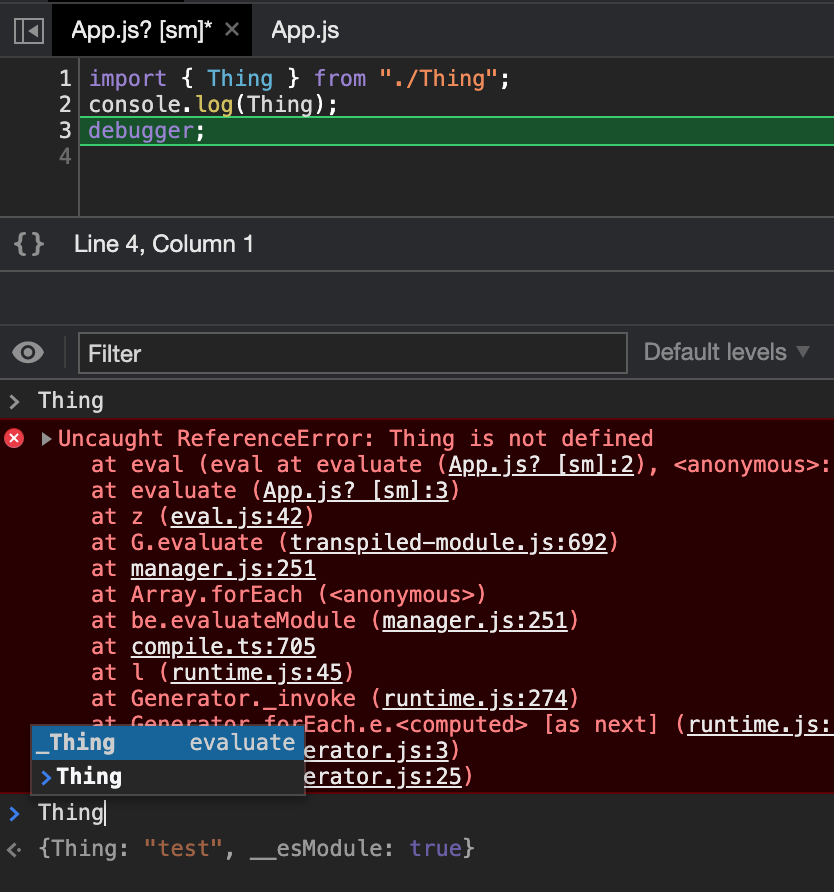
As of 2021, you get great assistance from your browser for that purpose. As you can see in the following picture, while Thing would be undefined, _Thing would give you the expected result and is even proposed by the autocompletion.
Also, pay attention to the [sm] in App.js[sm], it indicates that you are observing the source maps version and not the executed code.
![Visualization of source maps]()
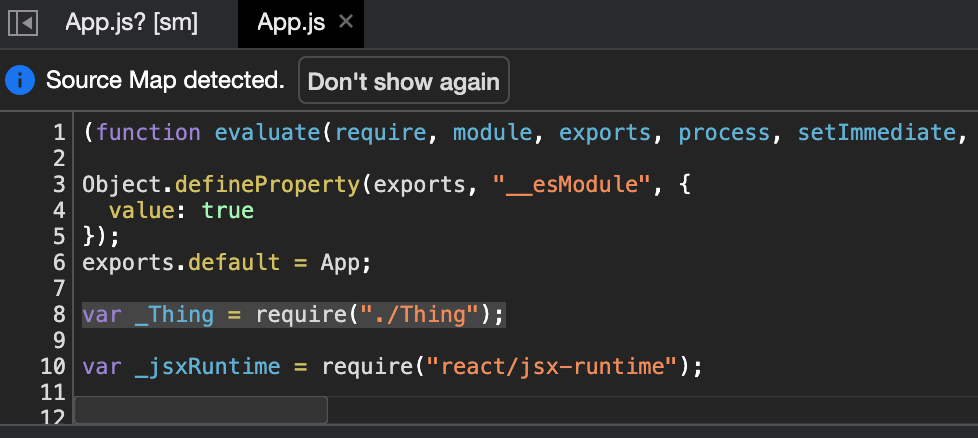
Alternatively, we could observe the compiled/executed code, and verify that the Thing was imported as _Thing.
![Visualization of the compiled code]()
Related and often experienced issues:
- The debugger is not able to stop at the desired breakpoint.
- Lines not available for breakpoints in the debugger.
- And console errors pointing to the uglified code.
If you desire to understand the reason, dive deeper into source maps:
How do source maps work?


m– Inteneratepiis defined aftersum, just a wild guess though... – Higinbotham