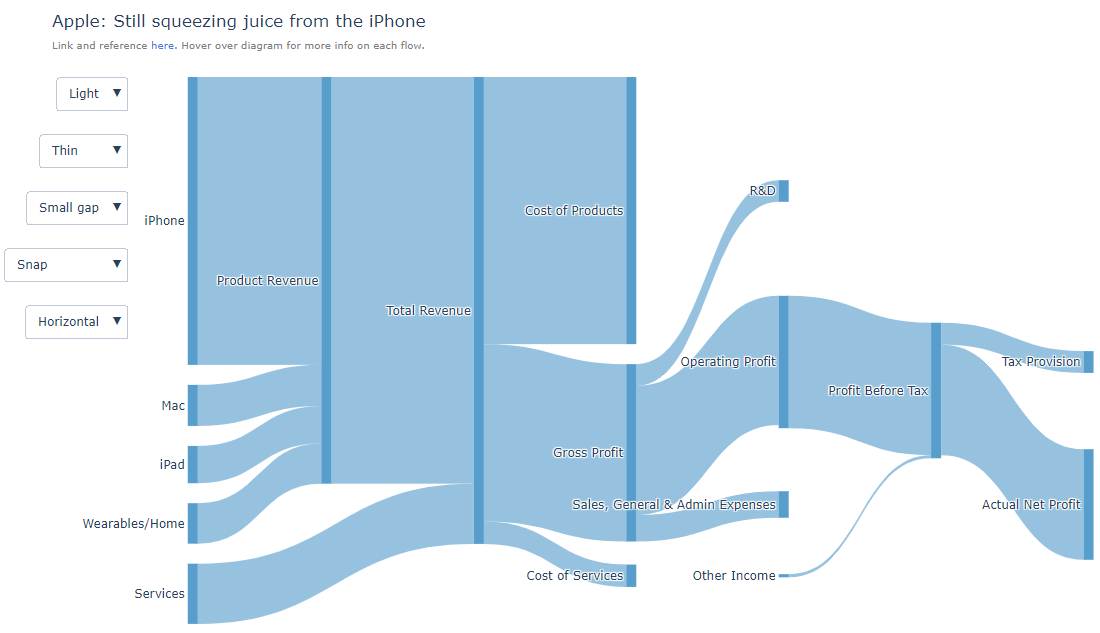
As of march 2023, Plotly still does not provide a way to specify the positioning of sankey node labels, but there is a way to override their coordinates using some javascript, which we can embed into python so the solution below works for both Plotly.js and Plotly.py (live demo).
First we need to introduce two parameters :
position - 'left' | 'center' | 'right'forcePos - true | false
By default, all labels are positioned to the right of their respective node, except for the last layer of nodes whose labels are positioned to the left (I guess to prevent text overflow and maximize the spacing between nodes), forcePos allows precisely to specify whether or not to force label placement regardless of the node layer.
The following function realigns all node labels according to these parameters :
const TEXTPAD = 3; // constant used in Plotly.js

function sankeyNodeLabelsAlign(position, forcePos) {
  const textAnchor = {left: 'end', right: 'start', center: 'middle'}[position];
  const nodes = gd.getElementsByClassName('sankey-node');

  for (const node of nodes) {
    const d = node.__data__;
    const label = node.getElementsByClassName('node-label').item(0);

    // Ensure to reset any previous modifications
    label.setAttribute('x', 0);

    if (!d.horizontal)
      continue;

    // This is how Plotly's default text positioning is computed (coordinates
    // are relative to that of the cooresponding node).
    const padX = d.nodeLineWidth / 2 + TEXTPAD;
    const posX = padX + d.visibleWidth;
    let x;

    switch (position) {
      case 'left':
        if (d.left || d.node.originalLayer === 0 && !forcePos)
          continue;
        x = -posX - padX;
        break;

      case 'right':
        if (!d.left || !forcePos)
          continue;
        x = posX + padX;
        break;

      case 'center':
        if (!forcePos && (d.left || d.node.originalLayer === 0))
          continue;
        x = (d.nodeLineWidth + d.visibleWidth)/2 + (d.left ? padX : -posX);
        break;
    }

    label.setAttribute('x', x);
    label.setAttribute('text-anchor', textAnchor);
  }
}
The idea is to trigger that function each time the chart is (re)plotted, for this purpose the plotly_afterplot event fits perfectly :
const gd = document.getElementById('graphDivId');
const position = 'left';
const forcePos = true;

gd.on('plotly_afterplot', sankeyNodeLabelsAlign.bind(gd, position, forcePos));
gd.emit('plotly_afterplot'); // manual trigger for initial rendering
For sankey charts built with Plotly.js, that's it.
For sankey charts built with Plotly.py, all we need is to embed this javascript code into a string which we can pass to plotly's Figure.show() method via the post_script parameter. The only difference is for identifying the graph div whose id is generated in this case, so we use the placeholder {plot_id} :
fig = go.Figure(data, layout)

js = '''
const TEXTPAD = 3; // constant used by Plotly.js

function sankeyNodeLabelsAlign(position, forcePos) { ... }

const gd = document.getElementById('{plot_id}');
const position = 'left';
const forcePos = true;

gd.on('plotly_afterplot', sankeyNodeLabelsAlign.bind(gd, position, forcePos));
gd.emit('plotly_afterplot');
'''

fig.show(post_script=[js])
NB. Passing a post script to show() works only with renderers that output HTML (a static export is not going to run javascript obviously). We can also pass a post script when using the methods write_html() or to_html().
Sankey Diagram example with position='left' and forcePos=true :
![screenshot]()


