Increase separation of edges in graphviz
Asked Answered
A

2

17

I am creating several UML activity diagrams with dot-graphviz and the edges/arrows (2+) converge in the same point whenever the target shape is a narrowed rectangle (H=0.5, W=0.05). This problem doesn't occur if the target shape is a square (H=0.5, W=0.5).

Here is a reduced dot example:

digraph G {
graph [ ranksep = 0.5, rankdir = LR ]
A4 [ shape = "record", height = 0.5, fontsize = 10, margin = "0.20,0.05", label = "Output\ to\rPreviewer", style = "rounded" ]
A5 [ shape = "rectangle", height = 0.5, width = 0.05, margin = "0,0", style = "filled", label = "" ]
A4 -> A5 [ shape = "edge", dir = "both", style = "solid", arrowtail = "none", arrowhead = "vee", labeldistance = 1, fontsize = 10 ]
A6 [ shape = "diamond", height = 0.5, width = 0.5, margin = "0,0", label = "" ]
A6 -> A5 [ shape = "edge", dir = "both", style = "solid", arrowtail = "none", arrowhead = "vee", labeldistance = 1, fontsize = 10, label = "[generate: false]" ]
A7 [ shape = "record", height = 0.5, fontsize = 10, margin = "0.20,0.05", label = "Output\ to\rFile", style = "rounded" ]
A6 -> A7 [ shape = "edge", dir = "both", style = "solid", arrowtail = "none", arrowhead = "vee", labeldistance = 1, fontsize = 10, label = "[generate: true]" ]
A8 [ shape = "doublecircle", height = 0.3, width = 0.3, margin = "0,0", label = "" ]
A7 -> A5 [ shape = "edge", dir = "both", style = "solid", arrowtail = "none", arrowhead = "vee", labeldistance = 1, fontsize = 10 ]
A5 -> A8 [ shape = "edge", dir = "both", style = "solid", arrowtail = "none", arrowhead = "vee", labeldistance = 1, fontsize = 10 ]
}

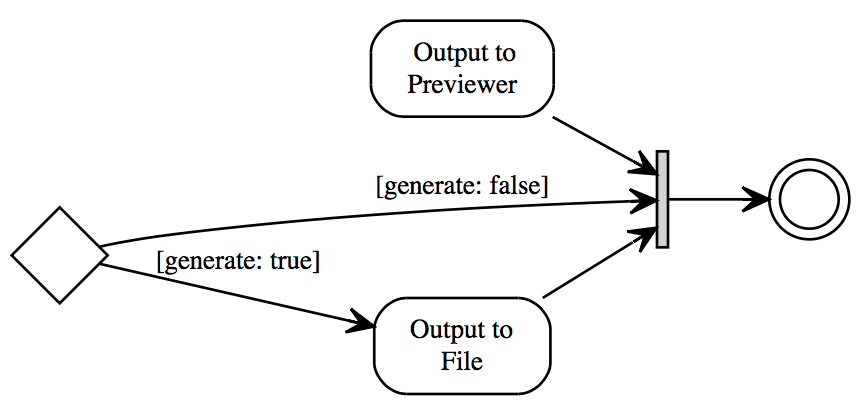
The text above generates the following graph in http://webgraphviz.com

Current output

The desirable output is the following
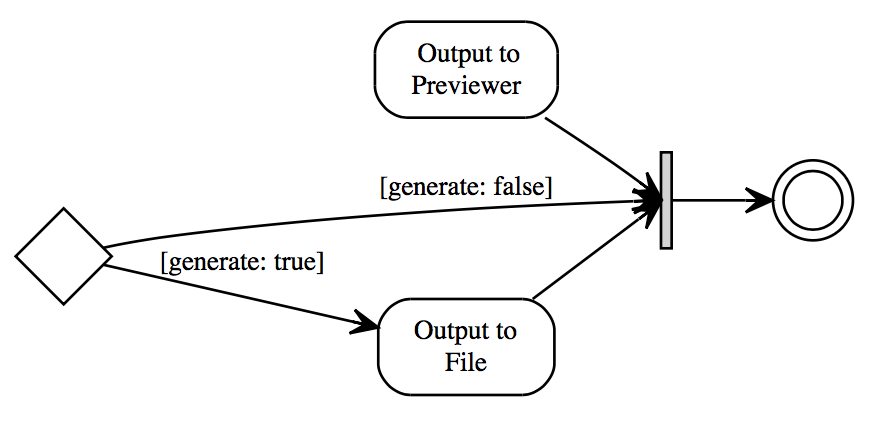
Desired output

Audly answered 5/8, 2016 at 4:9 Comment(3)
You could try A6 -> A5:nw and A7 -> A5:sw. Doesn't give you exactly your wanted output but at least separates the edges.Villein
@vaettchen, it doesn't sound like a universal solution and very specific for the provided example. It wouldn't help if there are 4 edges.Audly
Correct - I tried a solution for that specific question. Maybe you edit your post saying that you are looking for a generic solution for a larger number of edges / arrows.Villein
A
4

I found a tweak that produces a nice output, but requires a lot of processing and edge-count and direction awareness:

digraph G {
graph [ ranksep = 0.5, rankdir = LR ]
A4 [ shape = "record", height = 0.5, fontsize = 10, margin = "0.20,0.05", label = "Output\ to\rPreviewer", style = "rounded" ]
A5 [ shape = "record", height = 0.5, width = 0.05, margin = "0,0", style = "filled", label = "<f0>|<f1>|<f2>", fillcolor="black" ]
A4 -> A5:f0:w [ shape = "edge", dir = "both", style = "solid", arrowtail = "none", arrowhead = "vee", labeldistance = 1, fontsize = 10 ]
A6 [ shape = "diamond", height = 0.5, width = 0.5, margin = "0,0", label = "" ]
A6 -> A5:f1:w [ shape = "edge", dir = "both", style = "solid", arrowtail = "none", arrowhead = "vee", labeldistance = 1, fontsize = 10, label = "[generate: false]" ]
A7 [ shape = "record", height = 0.5, fontsize = 10, margin = "0.20,0.05", label = "Output\ to\rFile", style = "rounded" ]
A6 -> A7 [ shape = "edge", dir = "both", style = "solid", arrowtail = "none", arrowhead = "vee", labeldistance = 1, fontsize = 10, label = "[generate: true]" ]
A8 [ shape = "doublecircle", height = 0.3, width = 0.3, margin = "0,0", label = "" ]
A7 -> A5:f2:w [ shape = "edge", dir = "both", style = "solid", arrowtail = "none", arrowhead = "vee", labeldistance = 1, fontsize = 10 ]
A5 -> A8 [ shape = "edge", dir = "both", style = "solid", arrowtail = "none", arrowhead = "vee", labeldistance = 1, fontsize = 10 ]
}

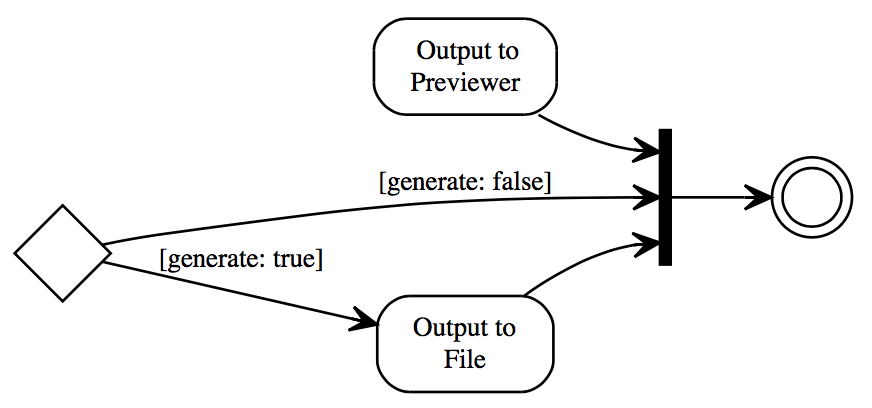
This is the output:

enter image description here

I still would like to know if there is a simpler solution.

Audly answered 5/8, 2016 at 7:2 Comment(1)
I am accepting my own answer as it produced the best result and can be extended to any number of edges.Audly
S
2

You can specify the output port of all edges to east and get preaty nice result (at least for that case):

digraph G {
        graph [ ranksep = 0.5, rankdir = LR ]
        edge [tailport=e]                    # <----- added this line
        A4 [ shape = "record", height = 0.5, fontsize = 10, margin = "0.20,0.05", label = "Output\ to\rPreviewer", style = "rounded" ]
        A5 [ shape = "rectangle", height = 0.5, width = 0.05, margin = "0,0", style = "filled", label = "" ]
        A4 -> A5 [ shape = "edge", dir = "both", style = "solid", arrowtail = "none", arrowhead = "vee", labeldistance = 1, fontsize = 10 ]
        A6 [ shape = "diamond", height = 0.5, width = 0.5, margin = "0,0", label = "" ]
        A6 -> A5 [ shape = "edge", dir = "both", style = "solid", arrowtail = "none", arrowhead = "vee", labeldistance = 1, fontsize = 10, label     = "[generate: false]" ]
        A7 [ shape = "record", height = 0.5, fontsize = 10, margin = "0.20,0.05", label = "Output\ to\rFile", style = "rounded" ]
        A6 -> A7 [ shape = "edge", dir = "both", style = "solid", arrowtail = "none", arrowhead = "vee", labeldistance = 1, fontsize = 10, label     = "[generate: true]" ]
        A8 [ shape = "doublecircle", height = 0.3, width = 0.3, margin = "0,0", label = "" ]
        A7 -> A5 [ shape = "edge", dir = "both", style = "solid", arrowtail = "none", arrowhead = "vee", labeldistance = 1, fontsize = 10 ]
        A5 -> A8 [ shape = "edge", dir = "both", style = "solid", arrowtail = "none", arrowhead = "vee", labeldistance = 1, fontsize = 10 ]
}

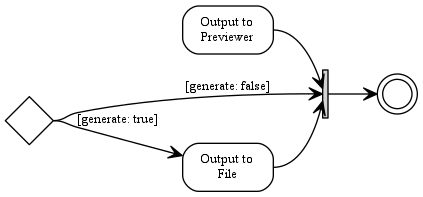
produce:

results

Sarnoff answered 16/8, 2016 at 15:32 Comment(2)
Hi Ohad, it looked like a good alternative a the first sight, but it is just a coincidence for the provided example. Try to comment the line A7 -> A5 and the original effect reappears.Audly
Although this is not a coincidence, you're right it's not a solution for all casesSarnoff

© 2022 - 2024 — McMap. All rights reserved.