I came up with a technique for determining who is sending a win32 window message across threads/processes during one-off debugging/troubleshooting sessions. It requires making a couple of assumptions so it's not 100% reliable, but so far I haven't found a case where it didn't work.
The basic idea is to exploit the fact that, when the message arrives, the recipient window thread is typically blocked waiting in its message loop (specifically, GetMessage()). When the message is delivered, the sending thread readies the receiving thread, pulling it out of its wait state.
It turns out that Windows provides ways to precisely trace which threads are readying which other threads, using Event Tracing for Windows. Using this feature, it is often possible to determine which thread sent the message - it's the thread that readied the receiving thread. It's even possible to see what the call stack of the sending thread was at the time it sent the message, and even the kernel side (win32k) part of the stack!
The basic procedure goes like this:
- Use the Windows Performance Recorder to start a trace. Make sure to include the "CPU usage" profile.
- Trigger the sending of the message you are interested in.
- Stop the trace.
- Open the trace in the Windows performance Analyzer.
- In the "CPU Usage (Precise)" graph, "Stacks" graph preset, zoom in on the time the message was received.
- One way is to locate the receiving thread and determine when it woke up.
- If correlation is difficult, it might be worth instrumenting the receiving thread using e.g. TraceLogging to produce a clear reference time point.
- You should be able to find a context switch event where the receiving thread is readied in
GetMessage.
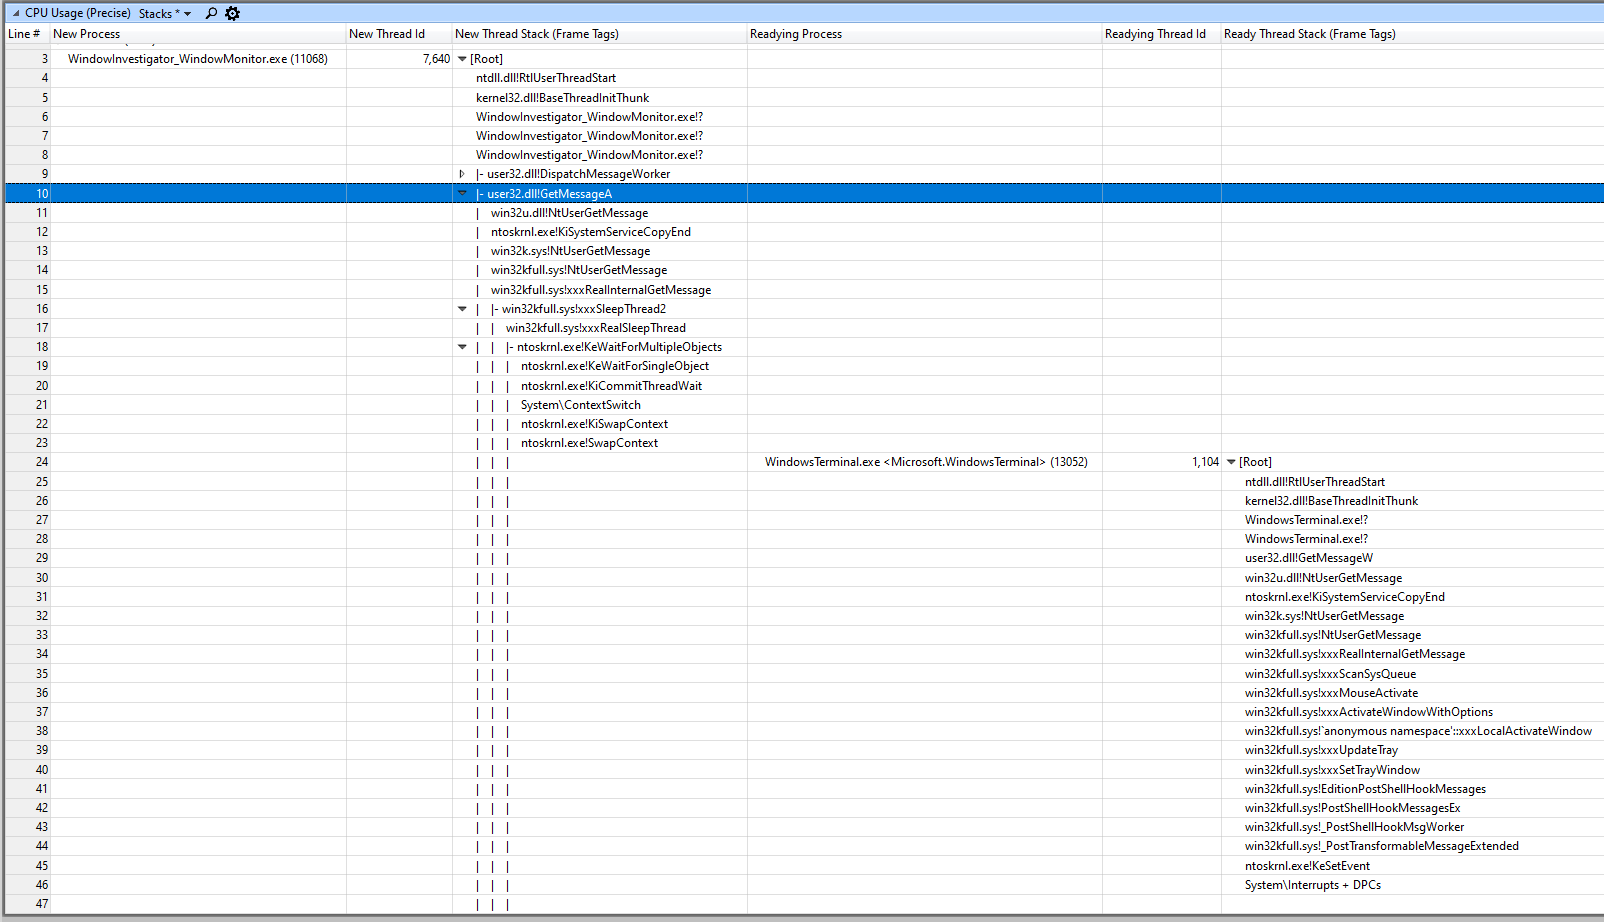
- The "Readying Process", "Readying Thread Id" and "Readying Thread Stack" columns will then show the details of the readying thread, which is likely to be the sender of the message.
For example, in the below screenshot, TID 7640 receives a shell hook message originating from WindowsTerminal.exe, TID 1104:
![WPA screenshot]()

