What can my 32-bit app be doing that consumes gigabytes of physical RAM?
Asked Answered
S

1

17

A co-worker mentioned to me a few months ago that one of our internal Delphi applications seems to be taking up 8 GB of RAM. I told him:

That's not possible

A 32-bit application only has a 32-bit virtual address space. Even if there was a memory leak, the most memory it could consume is 2 GB. After that allocations would fail (as there would be no empty space in the virtual address space). And in the case of a memory leak, the virtual pages will be swapped out to the pagefile, freeing up physical RAM.

But he noted that Windows Resource Monitor indicated that less than 1 GB of RAM was available on the system. And while our app was only using 220 MB of virtual memory: closing it freed up 8 GB of physical RAM.

So I tested it

I let the application run for a few weeks, and today I finally decided to test it.

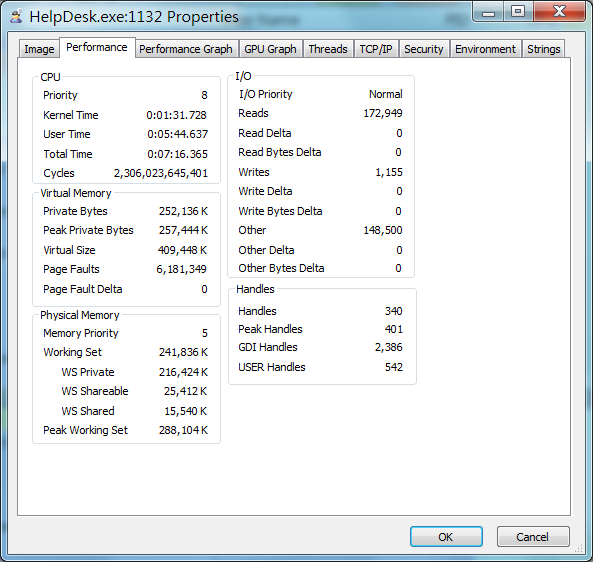
  1. First I look at memory usage before closing the app, using Process Explorer:

    • the working set (RAM) is: 241 MB
    • total virtual memory used: 409 MB

    Process explorer: performance

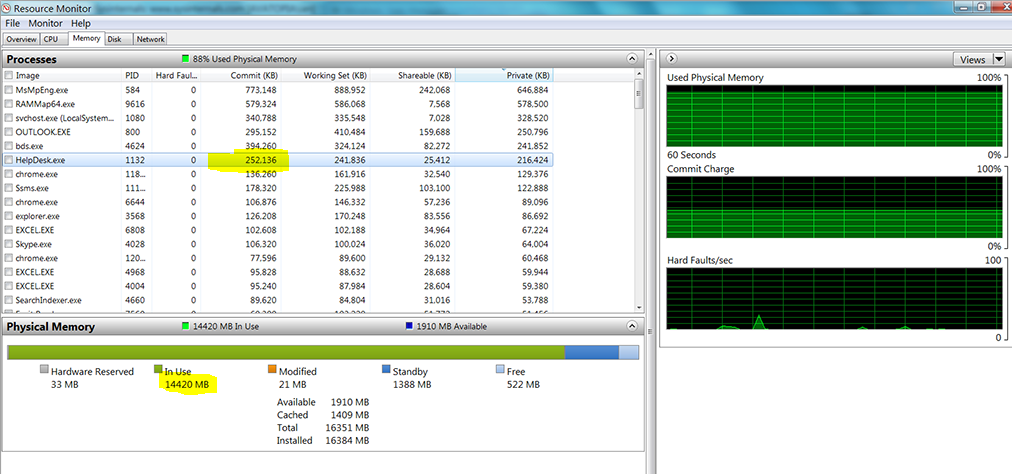
  2. And I used Resource Monitor to check memory used by the app, and total RAM in use:

    • virtual memory allocated by application: 252 MB
    • physical memory in use: 14 GB

    Resource Monitor: memory, before closing

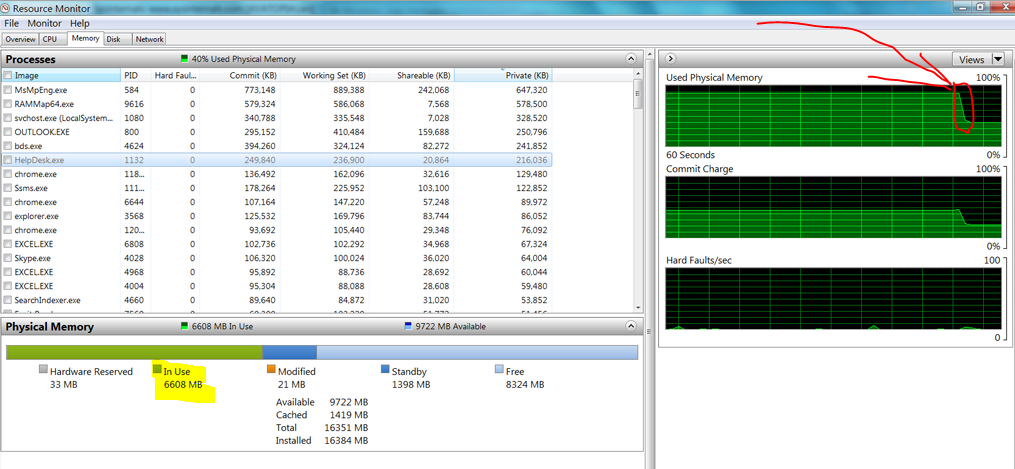
  3. And then memory usage after closing the app:

    • physical memory in use: 6.6 GB (7.4 GB less)

    Resource Monitor: memory, after closing

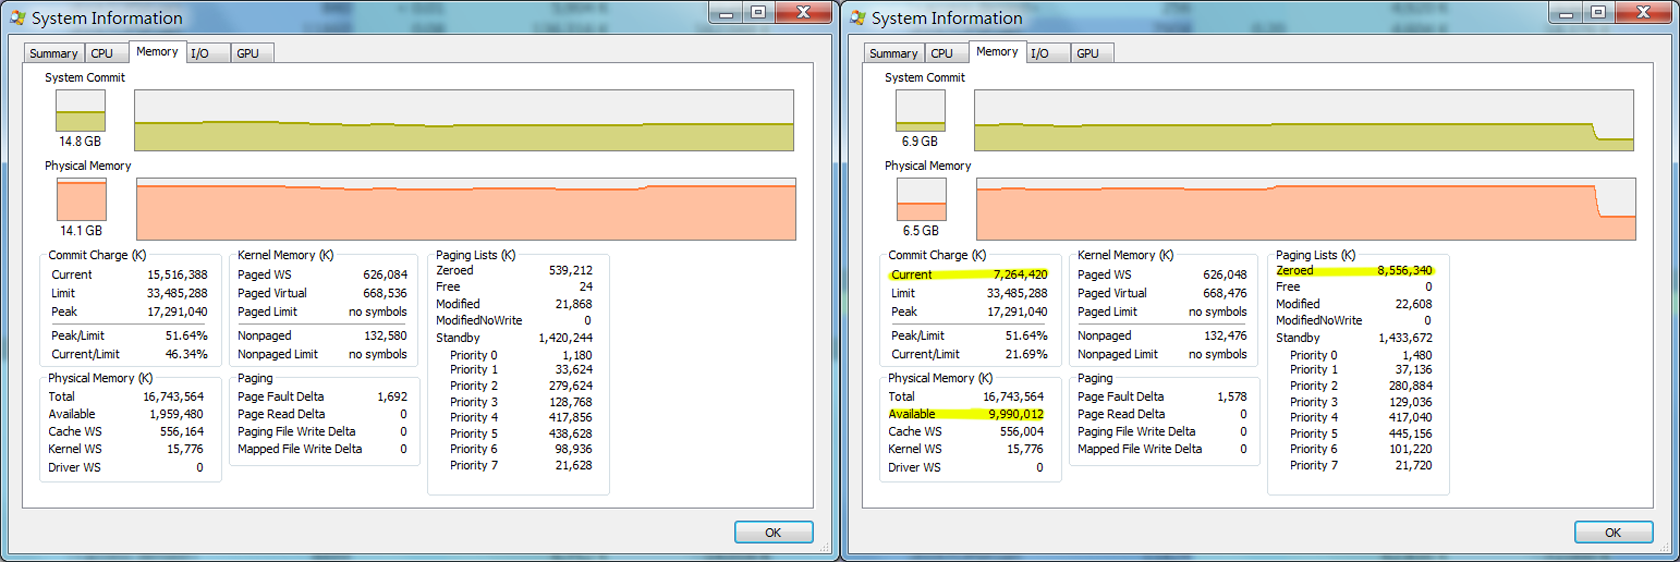
  4. I also used Process Explorer to look at a breakdown of physical RAM use before and after. The only difference is that 8 GB of RAM really was uncommitted and now free:

    Item Before After
    Commit Charge (K) 15,516,388 7,264,420
    Physical Memory Available (K) 1,959,480 9,990,012
    Zeroed Paging List (K) 539,212 8,556,340

    Process Explorer: system information, memory

Note: It's somewhat interesting that Windows would waste time instantly zeroing out all the memory, rather than simply putting it on a standby list, and zero it out as needed (as memory requests need to be satisfied).

None of those things explain what the RAM was doing (What are you doing just sitting there! What do you contain!?)

What is in that memory?

That RAM must contain something useful; it must have some purpose. For that I turned to SysInternals' RAMMap. It can break down memory allocations.

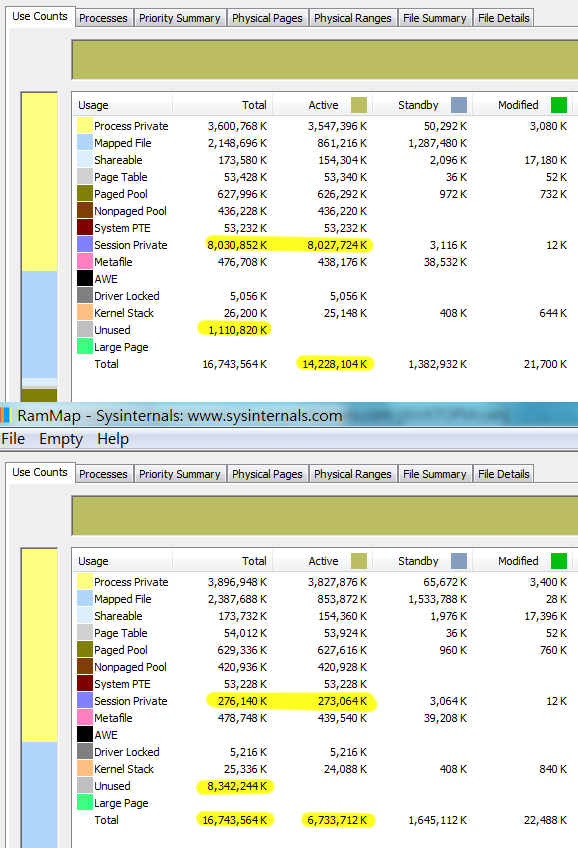
The only clue that RAMMap provides is that the 8 GB of physical memory was associated with something called Session Private. These Session Private allocations are not associated with any process (i.e. not my process):

Item Before After
Session Private 8,031 MB 276 MB
Unused 1,111 MB 8,342 MB

RAMMap: use counts

I'm certainly not doing anything with EMS, XMS, AWE, etc.

What could possibly be happening in a 32-bit non-Administrator application that is causing Windows to allocate an additional 7 GB of RAM?

  • It's not a cache of swapped out items
  • it's not a SuperFetch cache

It's just there, consuming RAM.

Session Private

The only information about "Session Private" memory is from a blog post announcing RAMMap:

Session Private: Memory that is private to a particular logged in session. This will be higher on RDS Session Host servers.

What kind of app is this?

This is a 32-bit native Windows application (i.e. not Java, not .NET). Because it is a native Windows application it, of course, makes heavy use of the Windows API.

It should be noted that I wasn't asking people to debug the application; I was hoping a Windows developer out there would know why Windows might hold memory that I never allocated. Having said that, the only thing changed recently (in the last 2 or 3 years) that could cause such a thing is the feature that takes a screenshot every 5 minutes and saves it to the user's %LocalAppData% folder. A timer fires every five minutes:

QueueUserWorkItem(TakeScreenshotThreadProc);

And pseudo-code of the thread method:

void TakeScreenshotThreadProc(Pointer data)
{
   String szFolder = GetFolderPath(CSIDL_LOCAL_APPDTA);
   ForceDirectoryExists(szFolder);

   String szFile = szFolder + "\\" + FormatDateTime("yyyyMMdd'_'hhnnss", Now()) + ".jpg";

   Image destImage = new Image();
   try
   {
      CaptureDesktop(destImage);
      
      JPEGImage jpg = new JPEGImage();
      jpg.CopyFrom(destImage); 
      jpg.CompressionQuality = 13;
      jpg.Compress();

      HANDLE hFile = CreateFile(szFile, GENERIC_WRITE, 
            FILE_SHARE_READ | FILE_SHARE_WRITE, null, CREATE_ALWAYS,
            FILE_ATTRIBUTE_ARCHIVE | FILE_ATTRIBUTE_ENCRYPTED, 0);
      //error checking elucidated
      try
      {
          Stream stm = new HandleStream(hFile);
          try
          {
             jpg.SaveToStream(stm);
          }
          finally
          {
             stm.Free();
          }
       }
       finally
       {
          CloseHandle(hFile);
       }
    }
    finally
    {
       destImage.Free();
    }
}
Skindeep answered 2/9, 2015 at 15:32 Comment(9)
As an aside, one should be usually be happy to find your RAM getting used. What's the point of stuffing all that RAM in there for it to lie idle?Horning
32-bit apps can use more than 2/3/4GB RAM with multiple processes (not multiple threads), or with Address Windowing Extension msdn.microsoft.com/en-us/library/windows/desktop/…Leatherback
From Technet: each user has their own session space mapped in virtual memory. Session space is divided into four different areas: Session Structure – Memory management control structures including session Working Set List. Session Image Space – holds a private copy of Win32k.sys modified data, a single copy of Win32k.sys code and unmodified data and various session drivers. Session View Space – session mapped views including desktop heap Session Paged Pool – paged pool memory used for this sessionPinole
Based on the definition (previous comment) I would imagine that the memory is being used to store window images for desktop composition or something of that ilk, Are you accessing the application through an RDS session or, if not, what desktop video settings do you have. If your GDI handles (which aren't excessive) include a lot of large visible windows this could be desktop composition images.Pinole
What is your application doing? Is there a huge usage of Windows API calls? What are those? Does your application try to write into the program files folder, so that your virtual store is growing over the time? I'm not sure how Microsoft handles the virtual store but it's maybe in the private session. Just guessing, to be honest.Metamorphosis
It may be caused by large amount of created and not released windows resources(handles). We are faced with such problem in one project.Bambi
Very brief example: in the console app: for i := 1 to 1000000 do FindFirst('c:\*', faAnyFile, sr); After this loop: app 133M, total 3GB, afle closing app: total 1.5 GBBambi
While I never trust pseudocode to be an accurate representation of the real thing, doubly so when debugging, you seem to forget to release your JPEGImage...Lilialiliaceous
@Lilialiliaceous Which is exactly the same conclusion i came to when looking back at the original code (Pascal; which i trans-coded to C#-ish)Skindeep
L
24

Most likely somewhere in your application you are allocating system resources and not releasing them. Any WinApi call that creates an object and returns a handle could be a suspect. For example (be careful running this on a system with limited memory - if you don't have 6GB free it will page badly):

Program Project1;

{$APPTYPE CONSOLE}
uses
  Windows;

var
  b : Array[0..3000000] of byte;
  i : integer;    
begin
  for i := 1 to 2000 do 
    CreateBitmap(1000, 1000, 3, 8, @b);
  ReadLn;
end.

This consumes 6GB of session memory due to the allocation of bitmap objects that are not subsequently released. Application memory consumption remains low because the objects are not created on the application's heap.

Without knowing more about your application, however, it is very difficult to be more specific. The above is one way to demonstrate the behaviour you are observing. Beyond that, I think you need to debug.

In this case, there are a large number of GDI objects allocated - this isn't necessarily indicative, however, since there are often a large number of small GDI objects allocated in an application rather than a large number of large objects (The Delphi IDE, for example, will routinely create >3000 GDI objects and this is not necessarily a problem).

enter image description here

In @Abelisto's example (in comments), by contrast :

Program Project1;

{$APPTYPE CONSOLE}
uses
  SysUtils;

var
  i : integer;
  sr : TSearchRec;
begin
  for i := 1 to 1000000 do FindFirst('c:\*', faAnyFile, sr);
  ReadLn;
end.

Here the returned handles are not to GDI objects but are rather search handles (which fall under the general category of Kernel Objects). Here we can see that there are a large number of handles used by the process. Again, process memory consumption is low but there is a large increase in session memory used.

enter image description here

Similarly, the objects might be User Objects - these are created by calls to things like CreateWindow, CreateCursor, or by setting hooks with SetWindowsHookEx. For a list of WinAPI calls that create objects and return handles of each type, see :

Handles and Objects : Object Categories -- MSDN

This can help you start to track down the issue by narrowing it to the type of call that could be causing the problem. It may also be in a buggy third-party component, if you are using any.

A tool like AQTime can profile Windows allocations, but I'm not sure if there is a version that supports Delphi5. There may be other allocation profilers that can help track this down.

Lilialiliaceous answered 2/9, 2015 at 17:34 Comment(1)
That is almost certainly the answer - leaking handles. It explains why it isn't my process that allocated the memory, and it fits with what i think the cause might be. Looking back up now at my question - in particular the screenshot of my application under Process Explorer, i can see that it had allocated 2,386 GDI handles. Should be easy enough to track it down now that i know what to look for. So the answer to the question: how can my application consume 8 GB of RAM: handles.Skindeep

© 2022 - 2024 — McMap. All rights reserved.