How to debug node.js application with Visual Studio 2013 and Node Tools NTVS
Asked Answered
T

3

17

I have moved an existing node.js + express project to VS because I prefer the IDE over JetBrains for now (used VS for years, only peeked into Webstorm).

I used NTVS new project->from existing sources and all files were imported successfully.

Afterwards, I opened the project settings of my project and set the node.exe arguments to bin\www, startup file for express.

When I press F5 (debug) I get the console.log messages I have put into the www and app.js files in the opening command prompt, and it looks like the server is running (cannot confirm, I want to debug if everything is working), but the VS debugger directly exits again, it also does not open any page in the browser I selected for debugging.

My node app actually is a REST webservice, so I want to test different URLs with different parameters.

Also, I cannot access the app on the port I specified, though when I directly start it from node.exe I can, even though the command prompt is still open.

(I have NTVS and WebEssentials installed - some operations take a long long time, but I attribute this to NTVS being still an early version.)

Question: how does the Visual Studio debugger stay connected to the node.js application so I can use breakpoints and use any browser then to connect and test different URLs? (Even a breakpoint put on the console.log that gets printed during startup is not being triggered.)

Trod answered 24/10, 2014 at 18:31 Comment(0)
T
24

For everyone who asks receives, and the one who searches finds....

(and yes, I did spend a long time searching and trying before posting here..)

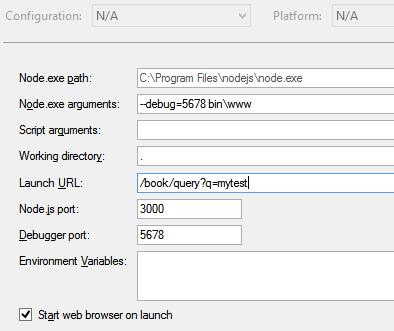
Settings

Kind of nice to debug node.js server with VS..

hope this helps someone

Edit: The arguments to node.exe can be hard to read in the image. It must be

 --debug=<portno>

that is with two dashes (and not just one) to specify the debug port.

Trod answered 24/10, 2014 at 19:5 Comment(5)
why do you have bin\www as an argument?Glassware
In this case, it was the startup file (express project).Trod
Hey @AndreasReiff for some reason the image isn't available for me. Any chance you could try uploading it again or provide a link to it?? ThanksBootlick
Did you try the image url at i.sstatic.net/x0tth.png ? What error do you get? Looks like a general problem you have with SO.Trod
For an Azure PaaS-project having ReactJS, this doesn't work.Malvasia
K
2

Not so much knowledge on expressjs but with a recent release of NTVS 1.0 Alpha, I did find it supports remote debugging which can be also used to debug nodejs app running locally - anyway haven't tried if it works with nodejs app + expressjs but it should.

I followed the step in this video https://youtu.be/-ir9ZB8lUg4 which is

  1. Run your nodejs with node.exe RemoteDebug.js <your_javascript_file>.
    RemoteDebug.js has come when you install NTVS.
  2. In Visual Studio, select Debug > Attach to Process
  3. Select Node.js remote debugging for Transport
  4. Enter localhost:5859 for Qualifier
  5. Click Attach

This will put Visual Studio in debugging mode which you can set a breakpoint, do step-in/step-out, very same experience when you use VS to debug .NET app.

Kerikeriann answered 20/5, 2015 at 13:33 Comment(0)
L
0

Its pretty straight forward with NTVS, you can download required version for your windows from github here

Once you install NTVS, NodeJS project templates will be added

Now, Goto File->New project -> Basic NodeJS Express 3 application (it will be available in javascript project templates)

Now just goto debug and select Start Debugging, add breakpoints where ever required and you can start debugging

Lest answered 29/7, 2015 at 8:8 Comment(0)

© 2022 - 2024 — McMap. All rights reserved.