Add KDE on to a histogram
Asked Answered
Q

3

17

I would like to add a density plot to my histogram diagram. I know something about pdf function but I've got confused and other similar questions were not helpful.

from scipy.stats import * 
from numpy import*
from matplotlib.pyplot import*
from random import*

nums = []
N = 100
for i in range(N):
    a = randint(0,9)
    nums.append(a)

bars= [0,1,2,3,4,5,6,7,8,9]
alpha, loc, beta=5, 100, 22

hist(nums,normed= True,bins = bars)


show()

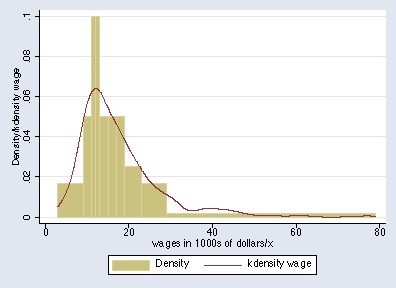
I'm looking for something like this

enter image description here

Qp answered 24/10, 2015 at 21:14 Comment(2)
You might be interested in seaborn's kdeplot function.Twice
See #33204145Cartridge
S
24
from scipy import stats
import numpy as np
import matplotlib.pyplot as plt
np.random.seed(41)

N = 100
x = np.random.randint(0, 9, N)
bins = np.arange(10)

kde = stats.gaussian_kde(x)
xx = np.linspace(0, 9, 1000)
fig, ax = plt.subplots(figsize=(8,6))
ax.hist(x, density=True, bins=bins, alpha=0.3)
ax.plot(xx, kde(xx))

plot

Sharika answered 25/10, 2015 at 4:24 Comment(5)
Shouldnt it be ax.plot(xx, kde) on last line instead?Scion
@ErroriSalvo, think of a kde as a fitted function. In the last line we evaluate kde at all positions in the array xx. It's similar to plotting a quadratic function: plot(x, lambda x: x**2)Sharika
in "plt, ax = plt.subplots(figsize=(8,6))", you might want to replace "plt" with "fig" on the LHS.Sitwell
@SolomonVimal, thanks for catching that. That was a typo!Sharika
After version 3.1.1 or so, normed keyword is no longer there, should use density instead. commit linkSegarra
C
4

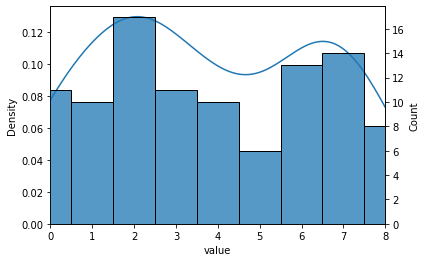
Here's a solution using seaborn 0.11.1 and pandas 1.1.5:

import matplotlib.pyplot as plt
import pandas as pd
import seaborn as sns
import numpy as np

N = 100
nums = [np.random.randint(i-i, 9) for i in range(N)]
df = pd.DataFrame(nums, columns=["value"])

fig, ax1 = plt.subplots()
sns.kdeplot(data=df, x="value", ax=ax1)
ax1.set_xlim((df["value"].min(), df["value"].max()))
ax2 = ax1.twinx()
sns.histplot(data=df, x="value", discrete=True, ax=ax2)

enter image description here

Note how I use numpy to generate the random values because I need actual values, not generators. The discrete=True in the last line assures that the ticks are centered.

Chloral answered 21/12, 2020 at 16:42 Comment(0)
B
3

distplot from Seaborn offers histogram plot as well as distribution graph together:

sns.distplot(df)
Beadle answered 17/10, 2021 at 23:16 Comment(2)
or sns.displot(df, kde=True) for displot, which supersedes distplotAssassin
Note that it returns the plot where y-axis Count instead of Density.Beadle

© 2022 - 2024 — McMap. All rights reserved.