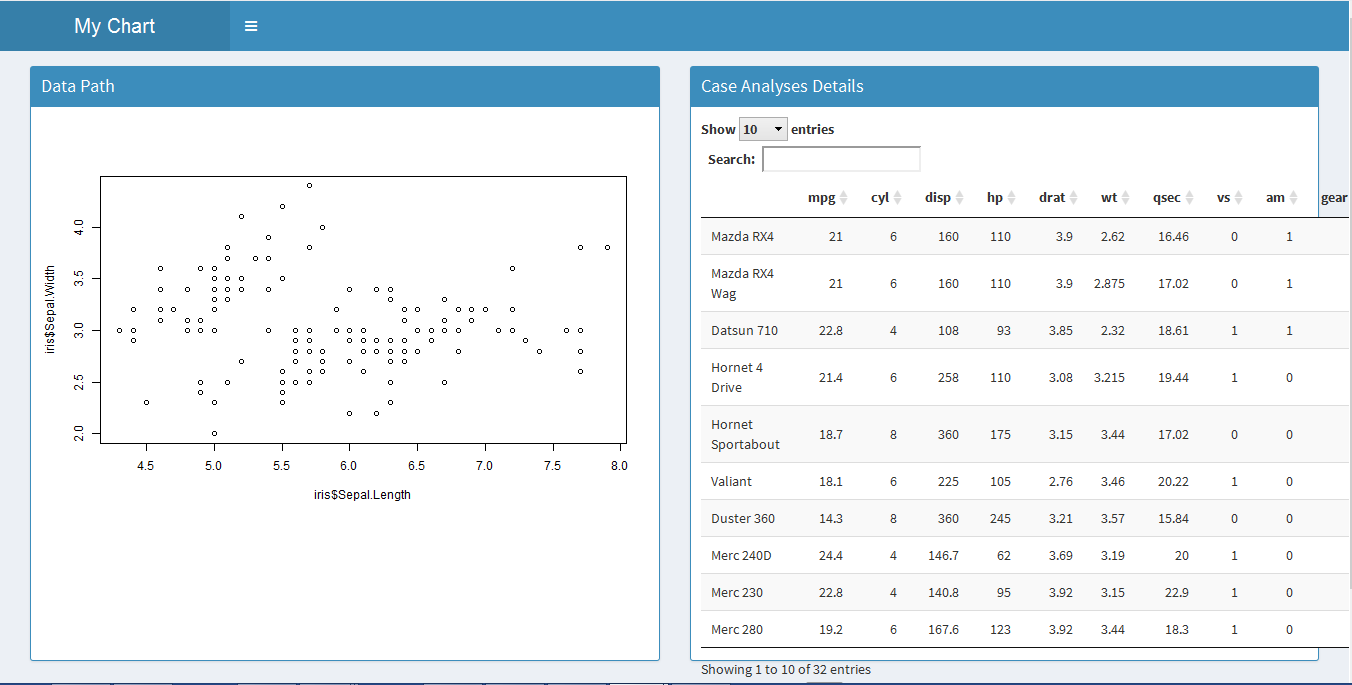
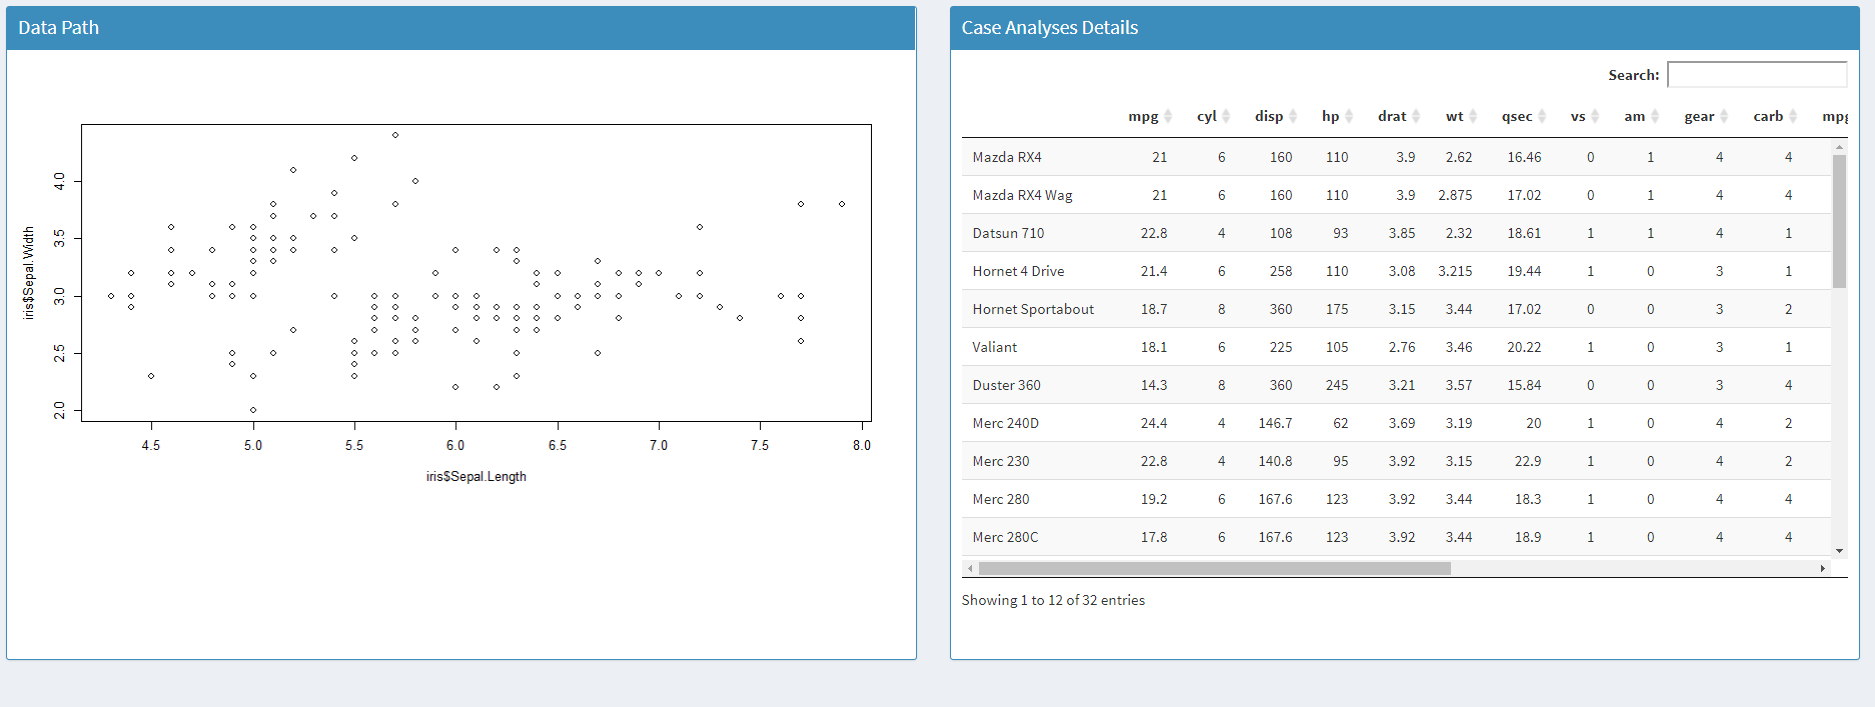
Please check the data table "Case Analyses Details" on the right. I want to fit the data table within the box, such that it aligns from right and bottom border in the box, such that we add a horizontal and vertical scroll bar to the DT which can be used to span the rows that overshoot the box.
## app.R ##
library(shiny)
library(shinydashboard)
library(DT)
ui <- dashboardPage(
dashboardHeader(title = "My Chart"),
dashboardSidebar(
width = 0
),
dashboardBody(
box(title = "Data Path", status = "primary",height = "595" ,solidHeader = T,
    plotOutput("trace_plot")),
box( title = "Case Analyses Details", status = "primary", height =
"595",width = "6",solidHeader = T,
     div(DT::dataTableOutput("trace_table",width = 220)))
))
server <- function(input, output)
{
#Plot for Trace Explorer
output$trace_plot <- renderPlot({
plot(iris$Sepal.Length,iris$Sepal.Width)
})
output$trace_table <- renderDataTable({
mtcars
})
}
shinyApp(ui, server)


div(style = 'overflow-x: scroll',DT::dataTableOutput("trace_table",width = "100%"))– Lathrope