We're running CakePHP 2.9, and using an Elasticache Cluster for Session Storage (which is stored via Memcached).
We've disabled PHP's in-built session garbage collection as recommended here: https://tideways.io/profiler/blog/php-session-garbage-collection-the-unknown-performance-bottleneck
session.gc_probability = 0
We have also set the probability setting to 0 within CakePHP's Cache config.
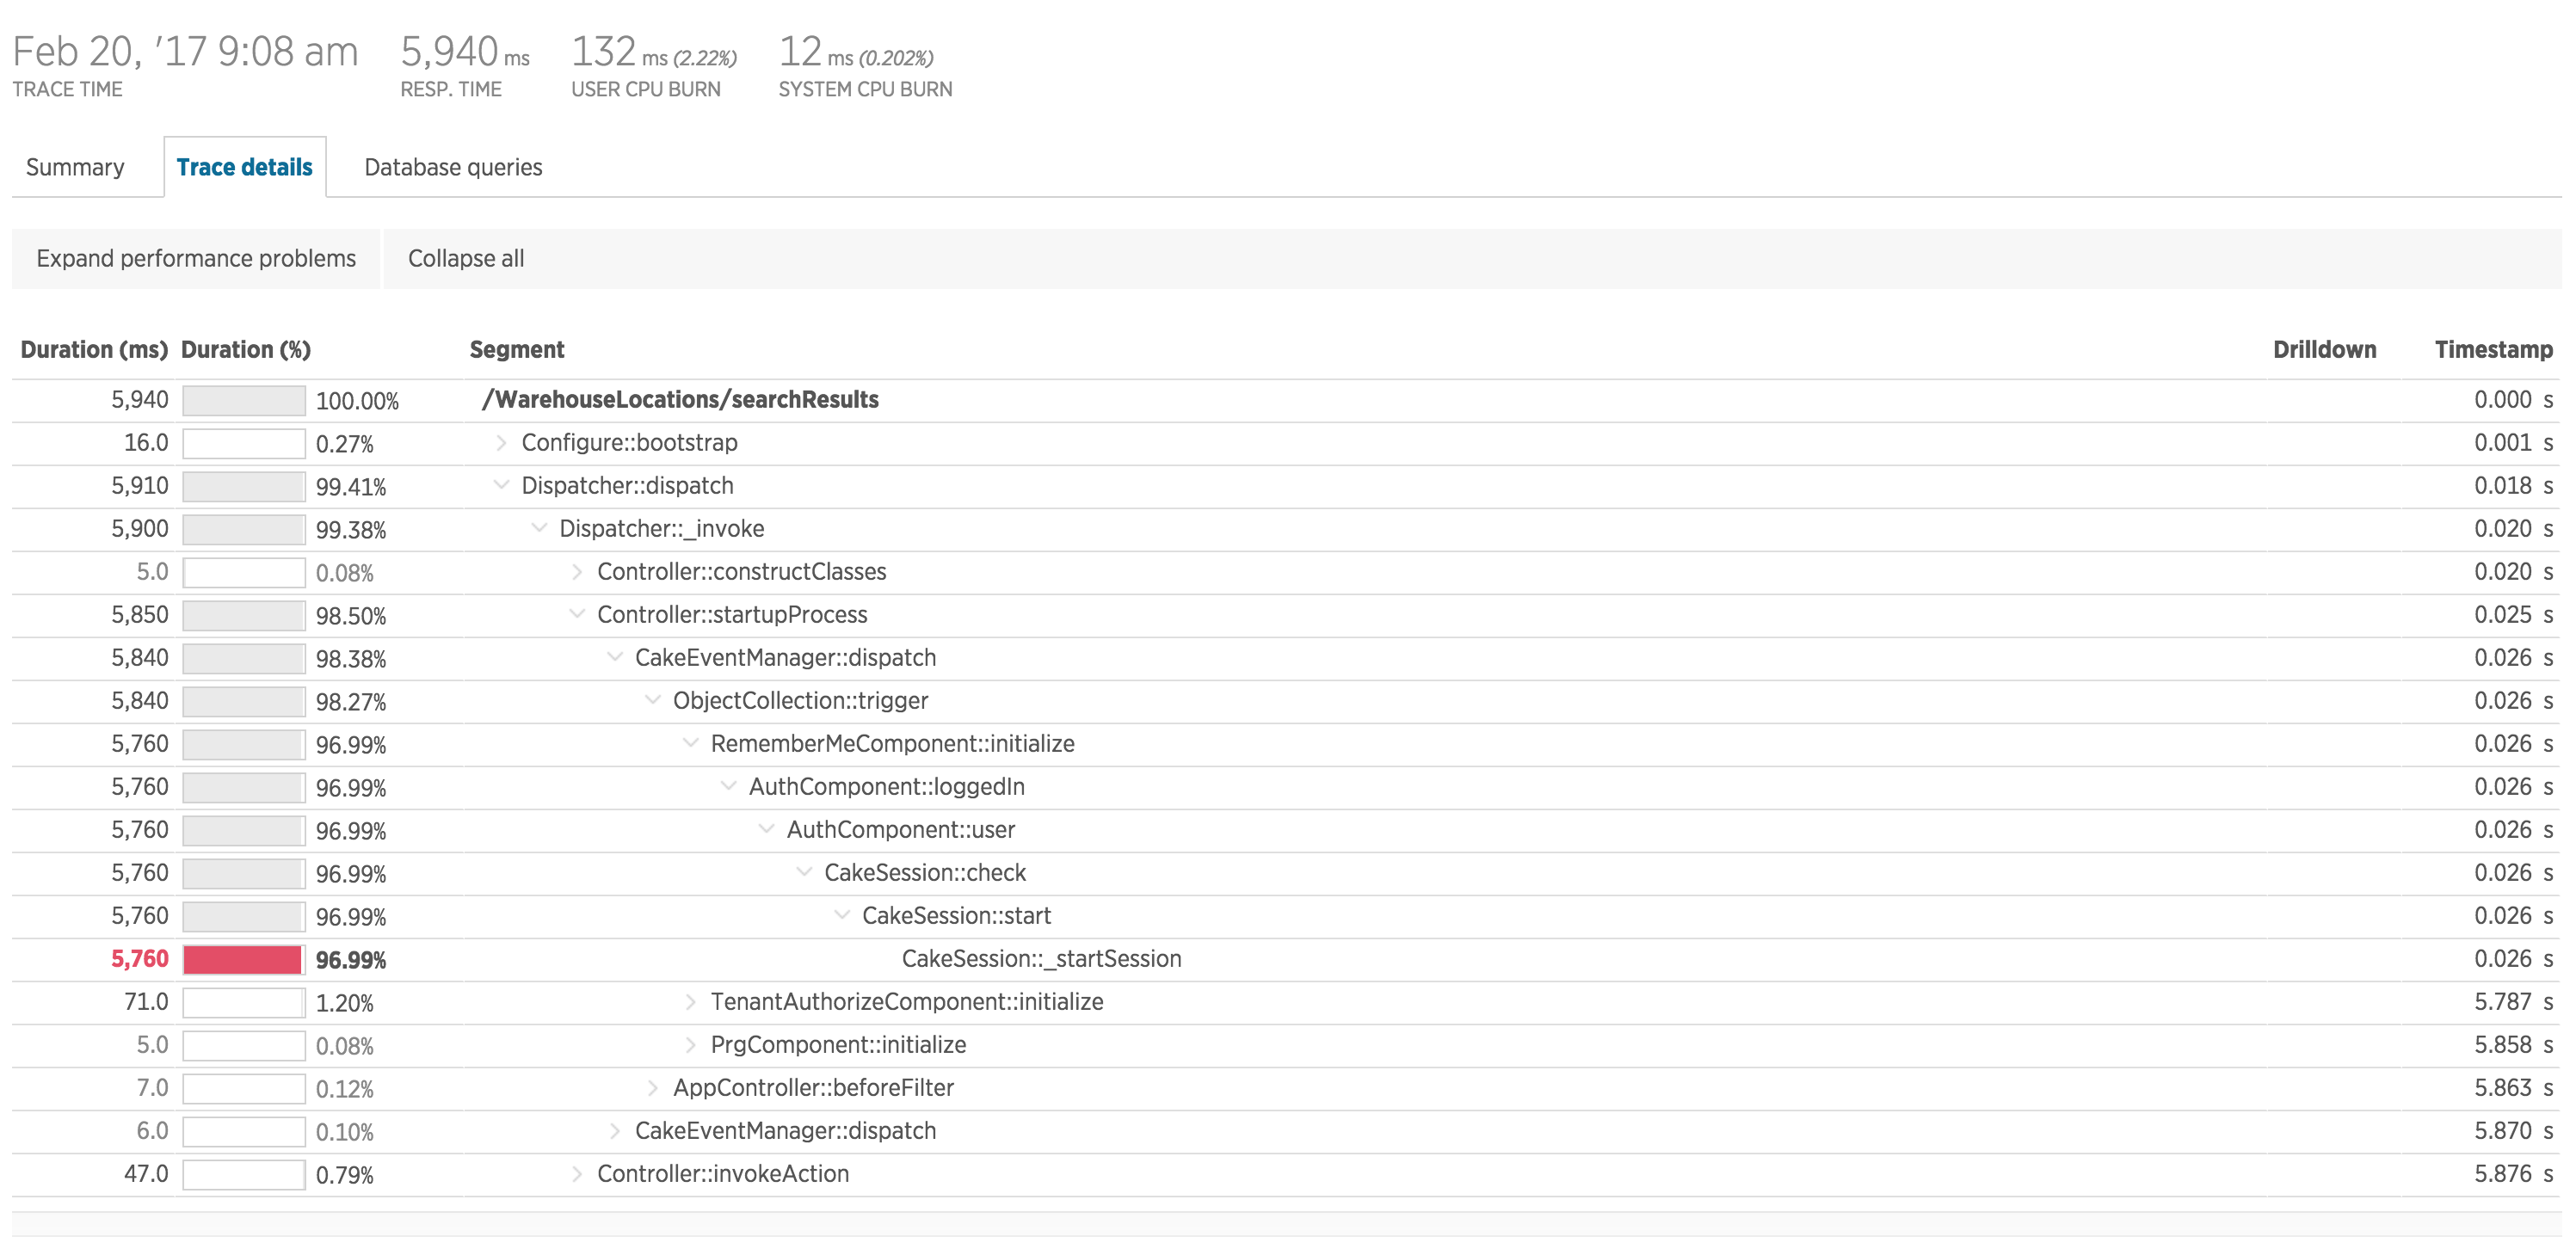
However; we're still having issues whereby occasionally we experience major slow-downs in CakeSession::_startSession, as reported by New Relic:
The Elasticache Cluster is not showing any metrics which would suggest there is a problem (unless there's some metric I'm not understanding correctly).
Any suggestions on how to diagnose this cause?


ttype instances and the burst quota is regularly being exceeded. – SaleswomanCakeSession::_startSession. The whole execution time forDispacher::dispachis only 5ms, includingCakeSession::_startSession. – Pyo