Too Low CPU Usage of Multithreaded Java Application on Windows
Asked Answered
R

5

18

I am working on a Java application for solving a class of numerical optimization problems - large-scale linear programming problems to be more precise. A single problem can be split up into smaller subproblems that can solved in parallel. Since there are more subproblems than CPU cores, I use an ExecutorService and define each subproblem as a Callable that gets submitted to the ExecutorService. Solving a subproblem requires calling a native library - a linear programming solver in this case.

Problem

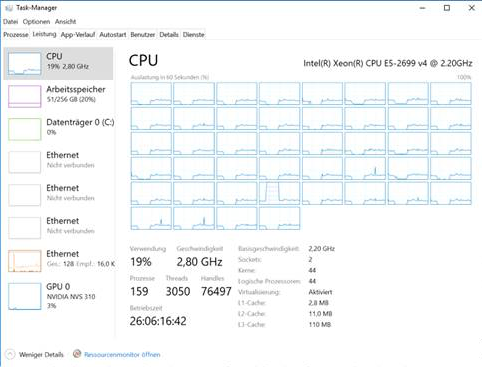
I can run the application on Unix and on Windows systems with up to 44 physical cores and up to 256g memory, but computation times on Windows are an order of magnitude higher than on Linux for large problems. Windows not only requires substantially more memory, but CPU utilization over time drops from 25% in the beginning to 5% after a few hours. Here is a screenshot of the task manager in Windows:

Task Manager CPU utilization

Observations

  • Solution times for large instances of the overall problem range from hours to days and consume up to 32g of memory (on Unix). Solution times for a subproblem are in the ms range.
  • I do not encounter this issue on small problems that take only a few minutes to solve.
  • Linux uses both sockets out-of-the-box, whereas Windows requires me to explicitly activate memory interleaving in the BIOS so that the application utilizes both cores. Whether of not I do this has no effect on the deterioration of overall CPU utilization over time though.
  • When I look at the threads in VisualVM all pool threads are running, none are on wait or else.
  • According to VisualVM, 90% CPU time is spend on a native function call (solving a small linear program)
  • Garbage Collection is not an issue since the application does not create and de-reference a lot of objects. Also, most memory seems to be allocated off-heap. 4g of heap are sufficient on Linux and 8g on Windows for the largest instance.

What I've tried

  • all sorts of JVM args, high XMS, high metaspace, UseNUMA flag, other GCs.
  • different JVMs (Hotspot 8, 9, 10, 11).
  • different native libraries of different linear programming solvers (CLP, Xpress, Cplex, Gurobi).

Questions

  • What drives the performance difference between Linux and Windows of a large multi-threaded Java application that makes heavy use of native calls?
  • Is there anything that I can change in the implementation that would help Windows, for example, should I avoid using an ExecutorService that receives thousands of Callables and do what instead?
Retrospection answered 14/11, 2019 at 20:29 Comment(30)
Have you tried ForkJoinPool instead of ExecutorService? 25% CPU utilization is really low if your problem is CPU bound.Foch
I have not. Why do you think that this would solve the problem?Retrospection
Your problem sounds like something that should push CPU to 100% and yet you are on 25%. For some problems ForkJoinPool is more efficient than manual scheduling.Foch
Cycling through Hotspot versions, have you made sure you are using the "server" and not "client" version? What is your CPU utilization on Linux? Also, Windows uptime of several days is impressive! What is your secret? :PEssie
Yes, it does use 100% (or close to it) on Linux but not on Windows.Retrospection
Could it be that your Windows server has an antivirus? Can you test on a server with a minimal Windows installation?Foch
@Essie Do you mean the server flag? I have tried that, it has no effect.Retrospection
@Karol Dowbecki: I ran it on several AWS Windows 2019 up to an expensive bare-metal as well as on a workstation. Except for whatever default is provided through Windows none of those have AV scanners running.Retrospection
Maybe try using Xperf to generate a FlameGraph. This could give you some insight what is the CPU doing (hopefully both user and kernel mode), but I never did it on Windows.Foch
@KarolDowbecki Thanks for the reference. I will check it out, but the CPU is busy with the call of a native function more than 90% of the time.Retrospection
Okay, do you mean that 90% of the 25% of CPU the process is using is in the native call, or that the CPU is at 100% with 90% in native code and 10% in Java?Essie
@Essie 90% of the 25% CPU (on Windows) as well as 90% of the 100% CPU (on Linux) are in the native callRetrospection
@KarolDowbecki The ForkJoinPool brings no relief.Retrospection
Did you also try different memory allocators in your solver?Galatea
@Galatea How do I try different memory allocators and what are those?Retrospection
They are responsible for dynamic memory allocation (malloc, realloc). When your solver code makes use of malloc, realloc, etc. then, in a long-running process the type of allocator may make a difference. It may also explain differences in various operating systems due to memory fragmentation and cache hit rates. See en.wikipedia.org/wiki/C_dynamic_memory_allocationGalatea
It's hard to guess without some example code. How do you read/write data your are saving? Maybe some additional read/write operations are the issue. Or try disabling all the windows defender functionalities - this sometimes can really slow down some applications.Starcrossed
@Starcrossed I will give this some more thought, but it's quite difficult to isolate into a code snippet (or several even). The application runs in-memory and Windows Defender is turned off.Retrospection
@Nils, both of runs (unix/win) uses same interface to call native library? I ask, because it looks like different. Like: win uses jna, linux jni.Walkerwalkietalkie
Hmm, @Retrospection didn't state whether he uses different native interfaces, but it sure looks like it was the case. Could definitely be the reason for the "order of magnitude" difference... github.com/java-native-access/jna/blob/master/www/… . But anyway I think he would have mentioned it if he employed different libraries on Linux and Windows.Vital
@Walkerwalkietalkie Both implementations use the same interface on both systems.Retrospection
@ChristophJohn Here is a link to one of the libraries I am using. The profiler does not identify repeated function calls as bottleneck. Most of the computation time is spend inside CLPNative.javaclpInitialSolve(Pointer<CLPSimplex>)Retrospection
I don't really have a solution without checking all that code. But here some things that I am asking myself: 1. You say that "Garbage Collection is not an issue since the application does not create and de-reference a lot of objects". OTOH you say "Solution times for a subproblem are in the ms range" and that solution times for the overall problem range from hours to days. So don't you create a lot of objects actually (for the subproblems)? Maybe you could activate GC logging to check. Or did you already verify in jvisualvm that GC is not the problem?Vital
2. Since you are using native memory quite heavily, I'd suggest you do some tracking to check. Example is here: baeldung.com/native-memory-tracking-in-jvm#9-nmt-over-time Please note that enabling NMT will result in about 5-10% performance drop (docs.oracle.com/javase/8/docs/technotes/guides/troubleshoot/…) 3. Are you passing the subproblems all at once to the Executor? Are you using a blocking task queue? Are you using a bounded task queue?Vital
4. I assume you retrieve the results of all the Callables that you submit? Or are you cancelling some of the Callables? 5. Are you heavily logging in your application so that I/O load might be slowing down the process? Good luck ;)Vital
Try this to see how many cores Java think it has Runtime.getRuntime().availableProcessors();Typeface
@ChristophJohn 1. The subproblems are not dereference but reused so GC really is not an issue; 2. Will look into this; 3. I am using a BlockingQueue; 4. I only use the callable to catch exceptions when a subproblem fails and do not cancel them, but runnables behave the same; 5. No. Thanks :)Retrospection
I ran into what looks like a very much the same issue and no solution so far. I have a trivially parallelizable workload, I'm submitting a lot of small tasks to an executor service (each taking milliseconds), with BlockingQueue in it so limit the amount of tasks submitted, CPU usage stuck at about 25% on windows, with a few orders of magnitudes slower processing (as much as 1000x slower on windows), with the vast majority of the work being spent in GZIP. I'm going to be working on creating a small test case that reproduces it as the application is already fairly small. Any solutions?Applicable
@Applicable Difficult to say if it is really the same issue, because GZIP probably involves harddrive operations, which linux/win may handle differently. For my case, I guess that the issue is the high memory load that is happening off-heap, which slows down Java multithreading under Windows. I worked around that problem by decreasing the memory footprint.Retrospection
@Retrospection While I can't say for sure, I found 2 issues reported and marked as fixed forever ago bugs.java.com/bugdatabase/view_bug.do?bug_id=5043044 and bugs.java.com/bugdatabase/view_bug.do?bug_id=6206933 that may seem relevant. This is highly speculative, but the way array access through JNI is implemented may cause issues with multiple threads being involved. And to be clear about my case of GZIP - all IO is done separately and is not a bottleneck.Applicable
S
2

For Windows the number of threads per process is limited by the address space of the process (see also Mark Russinovich - Pushing the Limits of Windows: Processes and Threads). Think this causes side effects when it comes close to the limits (slow down of context switches, fragmentation...). For Windows I would try to divide the work load to a set of processes. For a similar issue that I had years ago I implemented a Java library to do this more conveniently (Java 8), have a look if you like: Library to spawn tasks in an external process.

Shakitashako answered 23/11, 2019 at 16:35 Comment(2)
This looks very interesting! I am a bit hesitant to go this far (yet) for two reasons: 1) there will be a performance overhead of serializing and sending objects through sockets; 2) if I want to serialize everything this includes all dependencies that are linked in a task - it would be a bit of work to rewrite the code - nonetheless, thank you for the useful link(s).Retrospection
I fully share your concerns and redesigning the code would be some efforts. While traversing the graph you would need to introduce a threshold for the number of threads when it's time to split work into a new sub process. To address 2) have a look at Java memory-mapped file (java.nio.MappedByteBuffer), with that you could effectively share data between processes, for example your graph data. Godspeed :)Shakitashako
A
0

Sounds like windows is caching some memory to pagefile, after its being untouched for some time, and thats why the CPU is bottlenecked by the Disk speed

You can verify it with Process explorer and check how much memory is cached

Anemochore answered 21/11, 2019 at 23:52 Comment(2)
You think? There is enough free memory. Why would Windows start swapping? Anyways, thanks.Retrospection
At least on my laptop windows is swapping sometimes minimized applications, even with enough memoryAnemochore
E
0

I think this performance difference is due to how the O.S. manages the threads. JVM hide all OS difference. There are many sites where you can read about it, like this, for example. But it does not mean that the difference disappears.

I suppose you are running on Java 8+ JVM. Due to this fact, I suggest you to try to use stream and functional programming features. Functional programming is very usefully when you have many small independent problems and you want easily switch from sequential to parallel execution. The good news is that you don't have to define a policy to determine how many threads do you have to manage (like with the ExecutorService). Just for example (taken from here):

package com.mkyong.java8;

import java.util.ArrayList;
import java.util.List;
import java.util.stream.IntStream;
import java.util.stream.Stream;

public class ParallelExample4 {

    public static void main(String[] args) {

        long count = Stream.iterate(0, n -> n + 1)
                .limit(1_000_000)
                //.parallel()   with this 23s, without this 1m 10s
                .filter(ParallelExample4::isPrime)
                .peek(x -> System.out.format("%s\t", x))
                .count();

        System.out.println("\nTotal: " + count);

    }

    public static boolean isPrime(int number) {
        if (number <= 1) return false;
        return !IntStream.rangeClosed(2, number / 2).anyMatch(i -> number % i == 0);
    }

}

Result:

For normal streams, it takes 1 minute 10 seconds. For parallel streams, it takes 23 seconds. P.S Tested with i7-7700, 16G RAM, WIndows 10

So, I suggest you read about function programming, stream, lambda function in Java and try to implement a small number of test with your code (adapted to work in this new context).

Eserine answered 22/11, 2019 at 17:6 Comment(3)
I use streams in other parts of the software, but in this case tasks are created while traversing a graph. I would not know how to wrap this using streams.Retrospection
Can you traverse the graph, build a list and then using streams?Eserine
Parallel streams are only syntactic sugar for a ForkJoinPool. That I have tried (see @KarolDowbecki comment above).Retrospection
J
0

Would you please post the system statistics? Task manager is good enough to provide some clue if that is the only tool available. It can easily tell if your tasks are waiting for IO - which sounds like the culprit based on what you described. It may be due to certain memory management issue, or the library may write some temporary data to the disk, etc.

When you are saying 25% of CPU utilization, do you mean only a few cores are busy working at the same time? (It can be that all the cores works from time to time, but not simultaneously.) Would you check how many threads (or processes) are really created in the system? Is the number always bigger than the number of cores?

If there are enough threads, are many of them idle waiting for something? If true, you can try to interrupt (or attach a debugger) to see what they are waiting for.

Jobber answered 23/11, 2019 at 18:52 Comment(3)
I have added a screenshot of the task manager for an execution that is representative of this problem. The application itself creates as many threads as there are physical cores on the machine. Java contributes a little more than 50 threads to that figure. As already said VisualVM says all threads are busy (green). They just don't push the CPU to the limit on Windows. They do on Linux.Retrospection
@Retrospection I suspect you don't really have all the threads busy at the same time, but actually only 9 - 10 of them. They are scheduled randomly across all the cores, hence you have the 9/44 = 20% utilization in average. Can you use Java threads directly rather than ExecutorService to see the difference? It is not difficult to create 44 threads, and each grabbing the Runnable/Callable from a task pool/queue. (Although VisualVM shows all Java threads are busy, the reality can be that the 44 threads are scheduled quickly so that all of them get a chance to run in the sampling period of VisualVM.)Jobber
That’s a thought and something that I actually did at some point. In my implementation, I also made sure that native access is local to each thread, but this made no difference at all.Retrospection
Q
0

If you are endlessly starting and finishing new threads, this might be the reason. Reuse threads by means of pools, for example with FixedThreadPool:

ExecutorService executorService = Executors.newFixedThreadPool(10);
Future<String> future = executorService.submit(() -> "Hello World");
// some operations
String result = future.get();
Quiteris answered 9/8, 2023 at 17:20 Comment(0)

© 2022 - 2024 — McMap. All rights reserved.