Possible Memory Leak in Ignite DataStreamer
Asked Answered
L

4

18

I'm running Ignite in a Kubernetes cluster with persistence enabled. Each machine has a Java Heap of 24GB with 20GB devoted to durable memory with a memory limit of 110GB. My relevant JVM options are -XX:+AlwaysPreTouch -XX:+UseG1GC -XX:+ScavengeBeforeFullGC. After running DataStreamers on every node for several hours, nodes on my cluster hit their k8s memory limit triggering an OOM kill. After running Java NMT, I was surprised to find a huge amount of space allocated to internal memory.

Java Heap (reserved=25165824KB, committed=25165824KB)
(mmap: reserved=25165824KB, committed=25165824KB)  

Internal (reserved=42425986KB, committed=42425986KB)
(malloc=42425954KB #614365) 
(mmap: reserved=32KB, committed=32KB) 

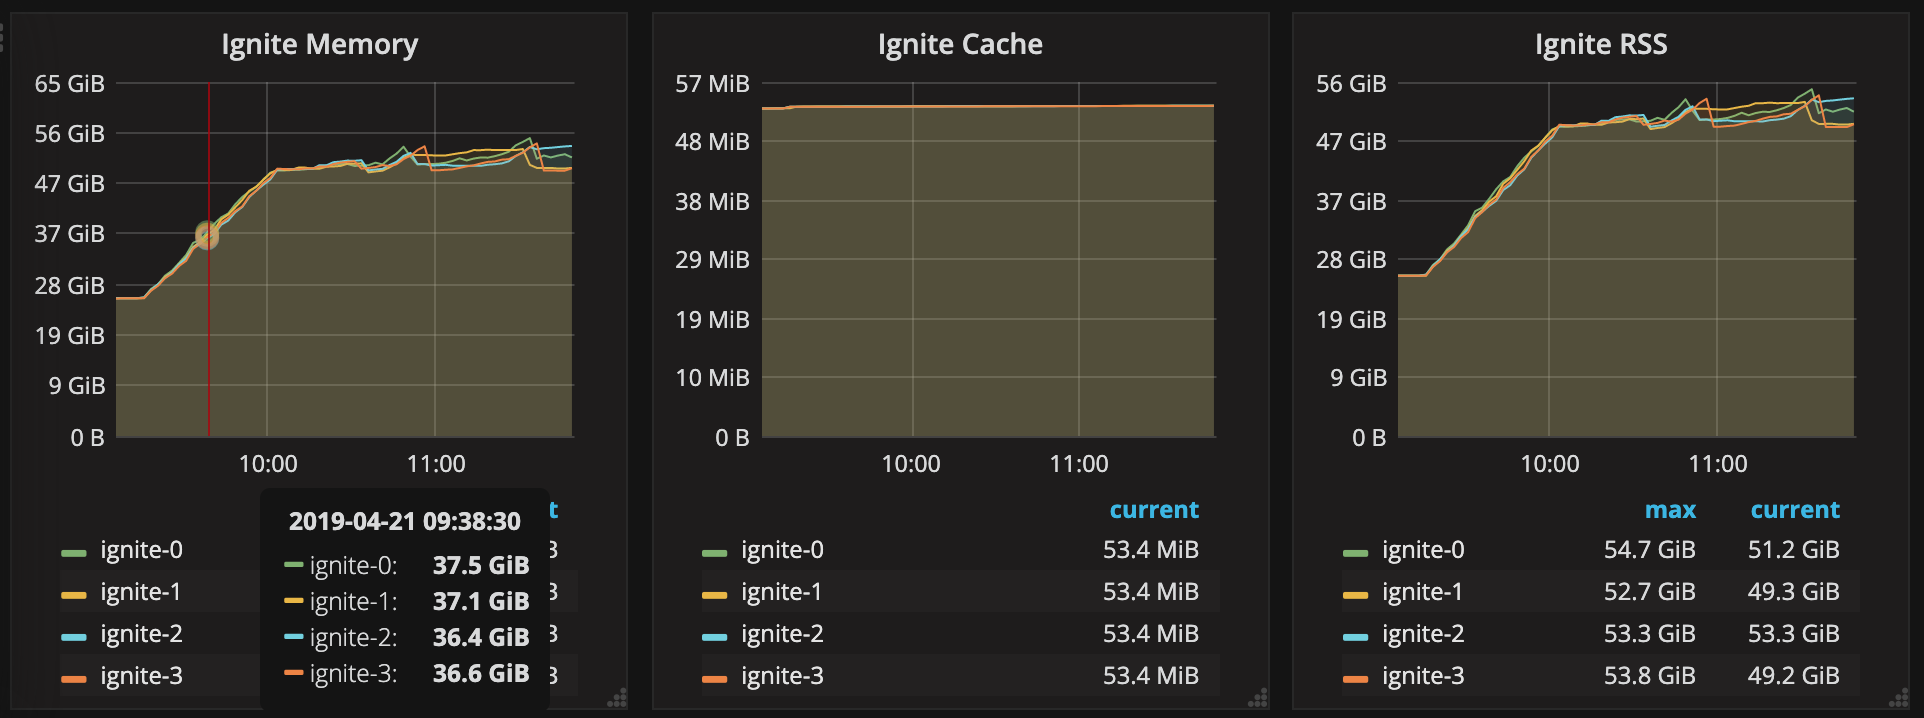
Kubernetes metrics confirmed this:

enter image description here

"Ignite Cache" is kernel page cache. The last panel "Heap + Durable + Buffer" is the sum of the ignite metrics HeapMemoryUsed + PhysicalMemorySize + CheckpointBufferSize.

I knew this couldn't be a result of data build-up because the DataStreamers are flushed after each file they read (up to about 250MB max), and no node is reading more than 4 files at once. After ruling out other issues on my end, I tried setting -XX:MaxDirectMemorySize=10G, and invoking manual GC, but nothing seems to have an impact other than periodically shutting down all of my pods and restarting them.

I'm not sure where to go from here. Is there a workaround in Ignite that doesn't force me to use a third-party database?

EDIT: My DataStorageConfiguration

    <property name="dataStorageConfiguration">
        <bean class="org.apache.ignite.configuration.DataStorageConfiguration">
            <property name="metricsEnabled" value="true"/>
            <property name="checkpointFrequency" value="300000"/>
            <property name="storagePath" value="/var/lib/ignite/data/db"/>
            <property name="walFlushFrequency" value="10000"/>
            <property name="walMode" value="LOG_ONLY"/>
            <property name="walPath" value="/var/lib/ignite/data/wal"/>
            <property name="walArchivePath" value="/var/lib/ignite/data/wal/archive"/>               
            <property name="walSegmentSize" value="2147483647"/>
            <property name="maxWalArchiveSize" value="4294967294"/>
            <property name="walCompactionEnabled" value="false"/>
            <property name="writeThrottlingEnabled" value="False"/>
            <property name="pageSize" value="4096"/>                
            <property name="defaultDataRegionConfiguration">
                <bean class="org.apache.ignite.configuration.DataRegionConfiguration">
                    <property name="persistenceEnabled" value="true"/>
                    <property name="checkpointPageBufferSize" value="2147483648"/>
                    <property name="name" value="Default_Region"/>
                    <property name="maxSize" value="21474836480"/>
                    <property name="metricsEnabled" value="true"/>
                </bean>
            </property>
        </bean>
    </property> 

UPDATE: When I disable persistence, internal memory is properly disposed of:

enter image description here

UPDATE: The issue is demonstrated here with a reproducible example. It's runnable on a machine with at least 22GB of memory for docker and about 50GB of storage. Interestingly the leak is only really noticeable when passing in a Byte Array or String as the value.

Lenard answered 18/4, 2019 at 19:6 Comment(0)
L
2

The memory leaks seems to be triggered by the @QueryTextField annotation on value object in my cache model, which supports Lucene queries in Ignite.

Originally: case class Value(@(QueryTextField@field) theta: String)

Changing this line to: case class Value(theta: String) seems to solve the problem. I don't have an explanation as to why this works, but maybe somebody with a good understanding of the Ignite code base can explain why.

Lenard answered 30/4, 2019 at 13:38 Comment(0)
H
2

TLDR

Set walSegmentSize=64mb (or just remove the setting and use the default) AND set -XX:MaxDirectMemorySize=<walSegmentSize * 4>.

Explanation

One thing people often forget when calculating Ignite's memory needs is direct memory buffer size.

Direct memory buffers are JVM-managed buffers allocated from a separate space in the Java process - it is neither Java heap, Ignite data region or Ignite checkpoint buffer.

Direct memory buffers are the normal way of interacting with non-heap memory in Java. There is a lot of things that use that (from JVM's internal code to applications) but in Ignite servers the main user of the direct memory pool is write-ahead log.

By default, Ignite writes to WAL using a memory-mapped file - which works through a direct memory buffer. The size of that buffer is the size of the WAL segment. And here we get to the fun stuff.

Your WAL segments are huge! 2GB - it's A LOT. Default is 64mb, and I've rarely seen an environment that would use more than that. In some specific workloads and for some specific disks we would recommend to set 256mb.

So, you have a 2GB buffers that are being created in the direct memory pool. The maximum size of the direct memory by default is equal to -Xmx - in your case, 24GB. I can see a scenario when your direct memory pool would bloat to 24GB (from the non-yet-cleared old buffered), making the total size of your application at least 20 + 2 + 24 + 24 = 70GB!.

This explains the 40GB of internal JVM memory (I think that's the data region + direct). This also explains why you don't see an issue when persistence is off - you don't have WAL in that case.

What to do

  1. Choose a sane walSegmentSize. I don't know the reason behind the 2GB choice but I would recommend to go either for the default of 64mb or for 256mb if you're sure you had issues with small WAL segments.

  2. Set a limit to JVM's direct memory pool via -XX:MaxDirectMemorySize=<size>. I find it a safe choice to set it to the value of walSegmentSize * 4, i.e. somewhere in the range 256mb-1gb.

Even if you see issues with memory consumption after making the above changes - keep them anyway, just because they are the best choice in for 99% of clusters.

Hickson answered 21/4, 2019 at 19:30 Comment(2)
Will try out this configuration. Just FYI, I took the 2GB WAL Segment Size from here: apacheignite.readme.io/docs/… though I didn't realize there were 10 segmentsLenard
Good insights into Ignite configuration issues, but ultimately this wasn't able to resolve the issue.Lenard
L
2

The memory leaks seems to be triggered by the @QueryTextField annotation on value object in my cache model, which supports Lucene queries in Ignite.

Originally: case class Value(@(QueryTextField@field) theta: String)

Changing this line to: case class Value(theta: String) seems to solve the problem. I don't have an explanation as to why this works, but maybe somebody with a good understanding of the Ignite code base can explain why.

Lenard answered 30/4, 2019 at 13:38 Comment(0)
S
0

I don't know what's "internal" in your case, but Ignite will normally store all its data in Off-Heap memory. Note that it's not 'direct' memory either.

You can configure the amount of memory dedicated to Off-Heap, as well as configure Page Eviction.

Seaward answered 19/4, 2019 at 6:33 Comment(5)
I'm sorry--I should have been more clear in my question from the beginning. Persistence is enabled on my cluster so page eviction isn't relevant in this case. I've edited the question to reflect. I understand that off-heap memory is configurable per data region in Ignite--I've shown the total amount of heap and off-heap memory ignite is "officially" consuming in the last panel of the image, which is far below the sum total of RSS usage, hence the leaking memory.Lenard
I haven't seen your Data Storage configuration so I can't comment whether there's any kind of data leak.Seaward
So you have 24G heap + 20G data region + around 2G checkpoint page buffer. You are saying that your Ignite process takes more than 46G RSS? That's strange.Seaward
Yes. It keeps increasing until it hits the pod limit of 110GB.Lenard
Folks, let's continue the conversation on Ignite user list. Ignite experts were looped in: apache-ignite-users.70518.x6.nabble.com/…Mirabelle
S
0

With and without persistence enabled, I can see a huge gap in ignite-cache metrics from your graphs. this means, with persistence you are actually writing data to the datastorage directory, wal, walArchive. If Kubernetes pod is also considering that directory in memory limit, then it may go out of memory soon enough.

Slur answered 21/4, 2019 at 16:38 Comment(1)
"Ignite Cache" is the kernel page cache for the Ignite container. Kubernetes doesn't factor in page cache when determining whether or not to kill a pod as it can just clear space as needed.Lenard

© 2022 - 2024 — McMap. All rights reserved.