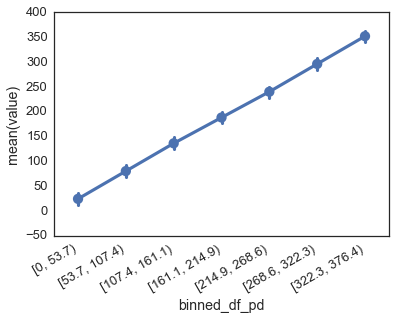
My dataframe has zero as the lowest value. I am trying to use the precision and include_lowest parameters of pandas.cut(), but I can't get the intervals consist of integers rather than floats with one decimal. I can also not get the left most interval to stop at zero.
import pandas as pd
import seaborn as sns
import matplotlib.pyplot as plt

sns.set(style='white', font_scale=1.3)

df = pd.DataFrame(range(0,389,8)[:-1], columns=['value'])
df['binned_df_pd'] = pd.cut(df.value, bins=7, precision=0, include_lowest=True)
sns.pointplot(x='binned_df_pd', y='value', data=df)
plt.xticks(rotation=30, ha='right')
I have tried setting precision to -1, 0 and 1, but they all output one decimal floats. The pandas.cut() help does mention that the x-min and x-max values are extended with 0.1 % of the x-range, but I thought maybe include_lowest could suppress this behaviour somehow. My current workaround involves importing numpy:
import numpy as np

bin_counts, edges = np.histogram(df.value, bins=7)
edges = [int(x) for x in edges]
df['binned_df_np'] = pd.cut(df.value, bins=edges, include_lowest=True)

sns.pointplot(x='binned_df_np', y='value', data=df)
plt.xticks(rotation=30, ha='right')
Is there a way to obtain non-negative integers as the interval boundaries directly with pandas.cut() without using numpy?
Edit: I just noticed that specifying right=False makes the lowest interval shift to 0 rather than -0.4. It seems to take precedence over include_lowest, as changing the latter does not have any visible effect in combination with right=False. The following intervals are still specified with one decimal point.


