Get confidence interval from sklearn linear regression in python
Asked Answered
L

1

18

I want to get a confidence interval of the result of a linear regression. I'm working with the boston house price dataset.

I've found this question: How to calculate the 99% confidence interval for the slope in a linear regression model in python? However, this doesn't quite answer my question.

Here is my code:

import numpy as np
import matplotlib.pyplot as plt
from math import pi

import pandas as pd
import seaborn as sns
from sklearn.datasets import load_boston
from sklearn.model_selection import train_test_split
from sklearn.linear_model import LinearRegression
from sklearn.metrics import mean_squared_error, r2_score

# import the data
boston_dataset = load_boston()

boston = pd.DataFrame(boston_dataset.data, columns=boston_dataset.feature_names)
boston['MEDV'] = boston_dataset.target

X = pd.DataFrame(np.c_[boston['LSTAT'], boston['RM']], columns=['LSTAT', 'RM'])
Y = boston['MEDV']

# splits the training and test data set in 80% : 20%
# assign random_state to any value.This ensures consistency.
X_train, X_test, Y_train, Y_test = train_test_split(X, Y, test_size=0.2, random_state=5)

lin_model = LinearRegression()
lin_model.fit(X_train, Y_train)

# model evaluation for training set

y_train_predict = lin_model.predict(X_train)
rmse = (np.sqrt(mean_squared_error(Y_train, y_train_predict)))
r2 = r2_score(Y_train, y_train_predict)

# model evaluation for testing set

y_test_predict = lin_model.predict(X_test)
# root mean square error of the model
rmse = (np.sqrt(mean_squared_error(Y_test, y_test_predict)))

# r-squared score of the model
r2 = r2_score(Y_test, y_test_predict)

plt.scatter(Y_test, y_test_predict)
plt.show()

How can I get, for instance, the 95% or 99% confidence interval from this? Is there some sort of in-built function or piece of code?

Lambeth answered 18/4, 2020 at 16:22 Comment(0)
L
12

If you're looking to compute the confidence interval of the regression parameters, one way is to manually compute it using the results of LinearRegression from scikit-learn and numpy methods.

The code below computes the 95%-confidence interval (alpha=0.05). alpha=0.01 would compute 99%-confidence interval etc.

import numpy as np
import pandas as pd
from scipy import stats
from sklearn.linear_model import LinearRegression

alpha = 0.05 # for 95% confidence interval; use 0.01 for 99%-CI.

# fit a sklearn LinearRegression model
lin_model = LinearRegression().fit(X_train, Y_train)

# the coefficients of the regression model
coefs = np.r_[[lin_model.intercept_], lin_model.coef_]
# build an auxiliary dataframe with the constant term in it
X_aux = X_train.copy()
X_aux.insert(0, 'const', 1)
# degrees of freedom
dof = -np.diff(X_aux.shape)[0]
# Student's t-distribution table lookup
t_val = stats.t.isf(alpha/2, dof)
# MSE of the residuals
mse = np.sum((Y_train - lin_model.predict(X_train)) ** 2) / dof
# inverse of the variance of the parameters
var_params = np.diag(np.linalg.inv(X_aux.T.dot(X_aux)))
# distance between lower and upper bound of CI
gap = t_val * np.sqrt(mse * var_params)

conf_int = pd.DataFrame({'lower': coefs - gap, 'upper': coefs + gap}, index=X_aux.columns)

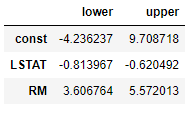
Using the Boston housing dataset, the above code produces the dataframe below:

res


If this is too much manual code, you can always resort to the statsmodels and use its conf_int method:

import statsmodels.api as sm
alpha = 0.05 # 95% confidence interval
lr = sm.OLS(Y_train, sm.add_constant(X_train)).fit()
conf_interval = lr.conf_int(alpha)

Since it uses the same formula, it produces the same output as above.


Convenient wrapper function:

import numpy as np
import pandas as pd
from scipy import stats
from sklearn.linear_model import LinearRegression


def get_conf_int(alpha, lr, X=X_train, y=Y_train):
    
    """
    Returns (1-alpha) 2-sided confidence intervals
    for sklearn.LinearRegression coefficients
    as a pandas DataFrame
    """
    
    coefs = np.r_[[lr.intercept_], lr.coef_]
    X_aux = X.copy()
    X_aux.insert(0, 'const', 1)
    dof = -np.diff(X_aux.shape)[0]
    mse = np.sum((y - lr.predict(X)) ** 2) / dof
    var_params = np.diag(np.linalg.inv(X_aux.T.dot(X_aux)))
    t_val = stats.t.isf(alpha/2, dof)
    gap = t_val * np.sqrt(mse * var_params)

    return pd.DataFrame({
        'lower': coefs - gap, 'upper': coefs + gap
    }, index=X_aux.columns)


# for 95% confidence interval; use 0.01 for 99%-CI.
alpha = 0.05
# fit a sklearn LinearRegression model
lin_model = LinearRegression().fit(X_train, Y_train)

get_conf_int(alpha, lin_model, X_train, Y_train)

Stats reference

Liberticide answered 4/12, 2022 at 5:36 Comment(2)
What if we want to calculate the confidence interval using bootstrap or cross-validation?Gentoo
@Gentoo I guess one way is to compute CI of each training set. However, I don’t know how relevant of a statistic it would be as CI is inferential while cross-validation is about improving predictions and the goals of the two problems don’t necessarily overlap.Liberticide

© 2022 - 2024 — McMap. All rights reserved.