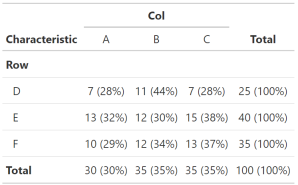
What I want is to print nice crosstabulations, either in a pdf file, or in a html file, from RStudio, using R, Markdown and knitr. I suspect I am missing something really obvious, because I cannot believe this is so hard. I make cross-tabs with either xtabs or ftable.
What I want is something like a nicely printed version of the R console output.
> x
   Col
Row  A  B  C
  D 15  9  7
  E 13 14  9
  F  8  8 17
> f
    Col  A  B  C
Row
D       15  9  7
E       13 14  9
F        8  8 17
I've tried several different solutions, none of which really works, and are shown in the attached .Rmd file. (I've tried pdf and html outputs.)
---
title: "trial"
author: "Anthony Staines"
date: "26/08/2014"
output: html_document
---
# Make the data
```{r, echo=TRUE,results='asis',message=FALSE}
library(knitr)
library(memisc)
library(xtable)
library(stargazer)
library(texreg)

set.seed(893)
Col <- sample(c('A','B','C'),100,replace=TRUE)
Row <- sample(c('D','E','F'),100,replace=TRUE)
```

```{r, echo=TRUE,results='asis',message=FALSE}
x <- xtabs(~Row+Col)
x
kable(x)
kable(x,format='html')
kable(x,format='html',output = TRUE)
xx <- xtable(format(x))
print(xx,type='html')
stargazer(x)

f <-ftable(Row,Col)
f
kable(f,format='html')
kable(f,format='html',output = TRUE)
xf <- xtable(format(f))
print(xf,type='html')
stargazer(f)
```
kable comes closest, but does not seem to support row or column names, both of which are essential to me :-
|   |  A|  B|  C|
|:--|--:|--:|--:|
|D  | 15|  9|  7|
|E  | 13| 14|  9|
|F  |  8|  8| 17|
Help appreciated, and my apologies if this is a really stupid question with an obvious and well known answer!
Anthony Staines


kable()does support column names; regarding row names, it does not seem to be a standard component of a table in either HTML or LaTeX, so it is unclear what "support" really means. – Cohort