set colorbar range with contourf
Asked Answered
S

1

18

This would appear to be a duplicate of this question:

Set Colorbar Range in matplotlib

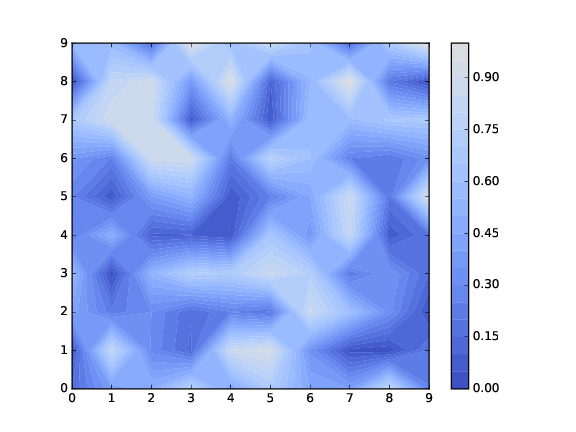
Essentially I want to set the colorbar range to set limits, e.g. 0 to 2. When I use vmin and vmax, the range of colors in contourf is correctly set, but colorbar only shows the clipped range, i.e. the solution in the link doesn't seem to work when using contourf. Am I missing something obvious?

import numpy as np
import matplotlib.pyplot as plt
fld=np.random.rand(10,10)
img=plt.contourf(fld,20,cmap='coolwarm',vmin=0,vmax=2)
plt.colorbar(img)

Resulting in

enter image description here

How can I force the colorbar range to be 0 to 2 with contourf?

Stencil answered 5/12, 2018 at 22:20 Comment(2)
np.random.rand will generate random uniform numbers in the range 0-1. `np.random.rand(10, 10)*2' will change the range to 0-2.Sepoy
thanks, yes, that is the idea of the reproducible example, I have data ranging 0-1 but want to plot with a larger range. My actually problem involves a large number of maps I want to compare using the same colorbar on each map, hence the question.Stencil
E
21

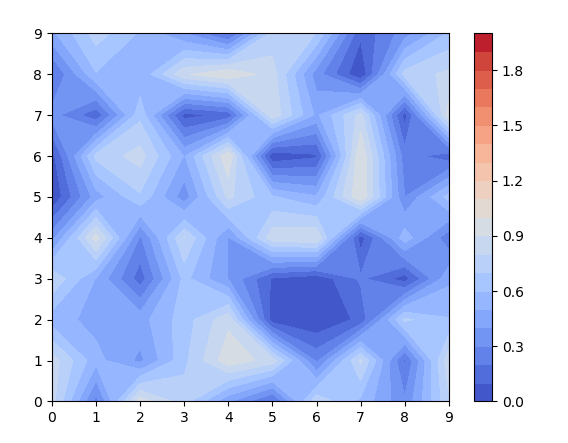
contourf indeed works a bit differently than other ScalarMappables. If you specify the number of levels (20 in this case) it will take them between the minimum and maximum data (approximately). If you want to have n levels between two specific values vmin and vmax you would need to supply those to the contouring function

levels = np.linspace(vmin, vmax, n+1)
plt.contourf(fld,levels=levels,cmap='coolwarm')

Complete code:

import numpy as np
import matplotlib.pyplot as plt
fld=np.random.rand(10,10)
levels = np.linspace(0,2,21)
img=plt.contourf(fld,levels=levels,cmap='coolwarm')
plt.colorbar(img)
plt.show()

enter image description here

Episiotomy answered 5/12, 2018 at 22:49 Comment(0)

© 2022 - 2024 — McMap. All rights reserved.