How to open the correct devtools console to see output from an extension script?
T

3

26

I am trying to test sample code for web extension for browsers. But, it doesn't work. I checked the console for Google Chrome and also for Firefox. It doesn't print anything. The following is my code:

manifest.json:

{
    "description": "Demonstrating webRequests",
    "manifest_version": 2,
    "name": "webRequest-demo",
    "version": "1.0",

    "permissions": [
        "webRequest"
    ],
    "background": {
        "scripts": ["background.js"]
    }
}

background.js:

function logURL(requestDetails) {
    console.log("Loading: " + requestDetails.url);
}

chrome.webRequest.onBeforeRequest.addListener(
    logURL,
    {urls: ["<all_urls>"]}
);
console.log("Hell o extension background script executed");

Am I missing something?

Theca answered 12/8, 2016 at 8:50 Comment(2)
Possible duplicate of How to use console.log() to debug a Chrome extension?Rotary
Technically, a duplicate of Where to read console messages from background.js in a Chrome extension? Practically, has some independent worth as it asked for Firefox-specific info and has a corresponding answer. So, not swinging the dupehammer.Lunula
A
53

Your code is correct as written, it works and outputs to console.
If you are not seeing it, then you are, probably, looking at the wrong console.

1. Firefox

Mozilla describes what extension output can be seen in which console in their Debugging article.

  • Browser Console

    The Browser Console no longer shows output from WebExtensions background pages by default. You can have it show output from all WebExtensions by selecting to display "Show Content Messages", which is available from the popup that opens when you click on the gear-like symbol "⚙️" in the upper right of the window, just to the right of "Requests". Depending on what you are doing, the Browser Console may show output from a WebExtensions Experiment. You can access the Browser Console from Tools➜Web Developer➜Browser Console (keyboard shortcut Ctrl-Shift-J, or Cmd-Shift-J on Mac).

    In older versions of Firefox, this was the console to use to see output from extensions. However, that is no longer the case.

  • Browser Toolbox

    If you have it enabled, you could also use the Browser Toolbox console. You can access it from Tools➜Web Developer➜Browser Toolbox (keyboard shortcut Ctrl-Alt-Shift-I; On a Mac: Cmd-Alt-Shift-I). If it is not available you can enable it through options from the Web Console settings page.

    The console in this toolbox will show output from both scripts running in the background context and from content scripts. However, complex data will not be available (e.g. no Objects).

  • Add-on Debugger

    This is what you should be using to view console output from scripts running in the background context of your WebExtension. This includes background scripts, scripts running in popups, options pages, and any other page loaded from the extension as the main URL for a tab, or iframe. You can access the Add-on Debugger though about:debugging➞Inspect (use the "Inspect" button that's associated with the WebExtension you are debugging; there's a separate button for each extension). This will open a new tab with the debugger. You can then click on the Console tab within that browser tab. This console will display only content from the WebExtension which you are inspecting.

  • Web Console

    You, probably, are looking at the Web Console (keyboard shortcut F12) which is associated with only a single tab. This is what you want when debugging a webpage, but not an add-on's background scripts. For a content script which is injected in that tab, the console.log() output will show up in this console. However, you will not see output from any other portion of your add-on (e.g. not content scripts in other tabs, not background scripts, etc.).

2. Google Chrome

Showing the correct console for your extension is a bit more complex in Chrome. Console output will show up in only one of multiple possible places, depending on from what context the console.log() was executed. Each of the following DevTools are independent of each other and are displayed in separate windows, or tabs. Displaying in the associated tab (bottom or side) is the default for the DevTools associated with web pages and content scripts, because those are specific to the tab. For the web page/content script DevTools, you have the option of having it displayed in its own separate window, or docked inside the tab (side or bottom).

  • Background Scripts

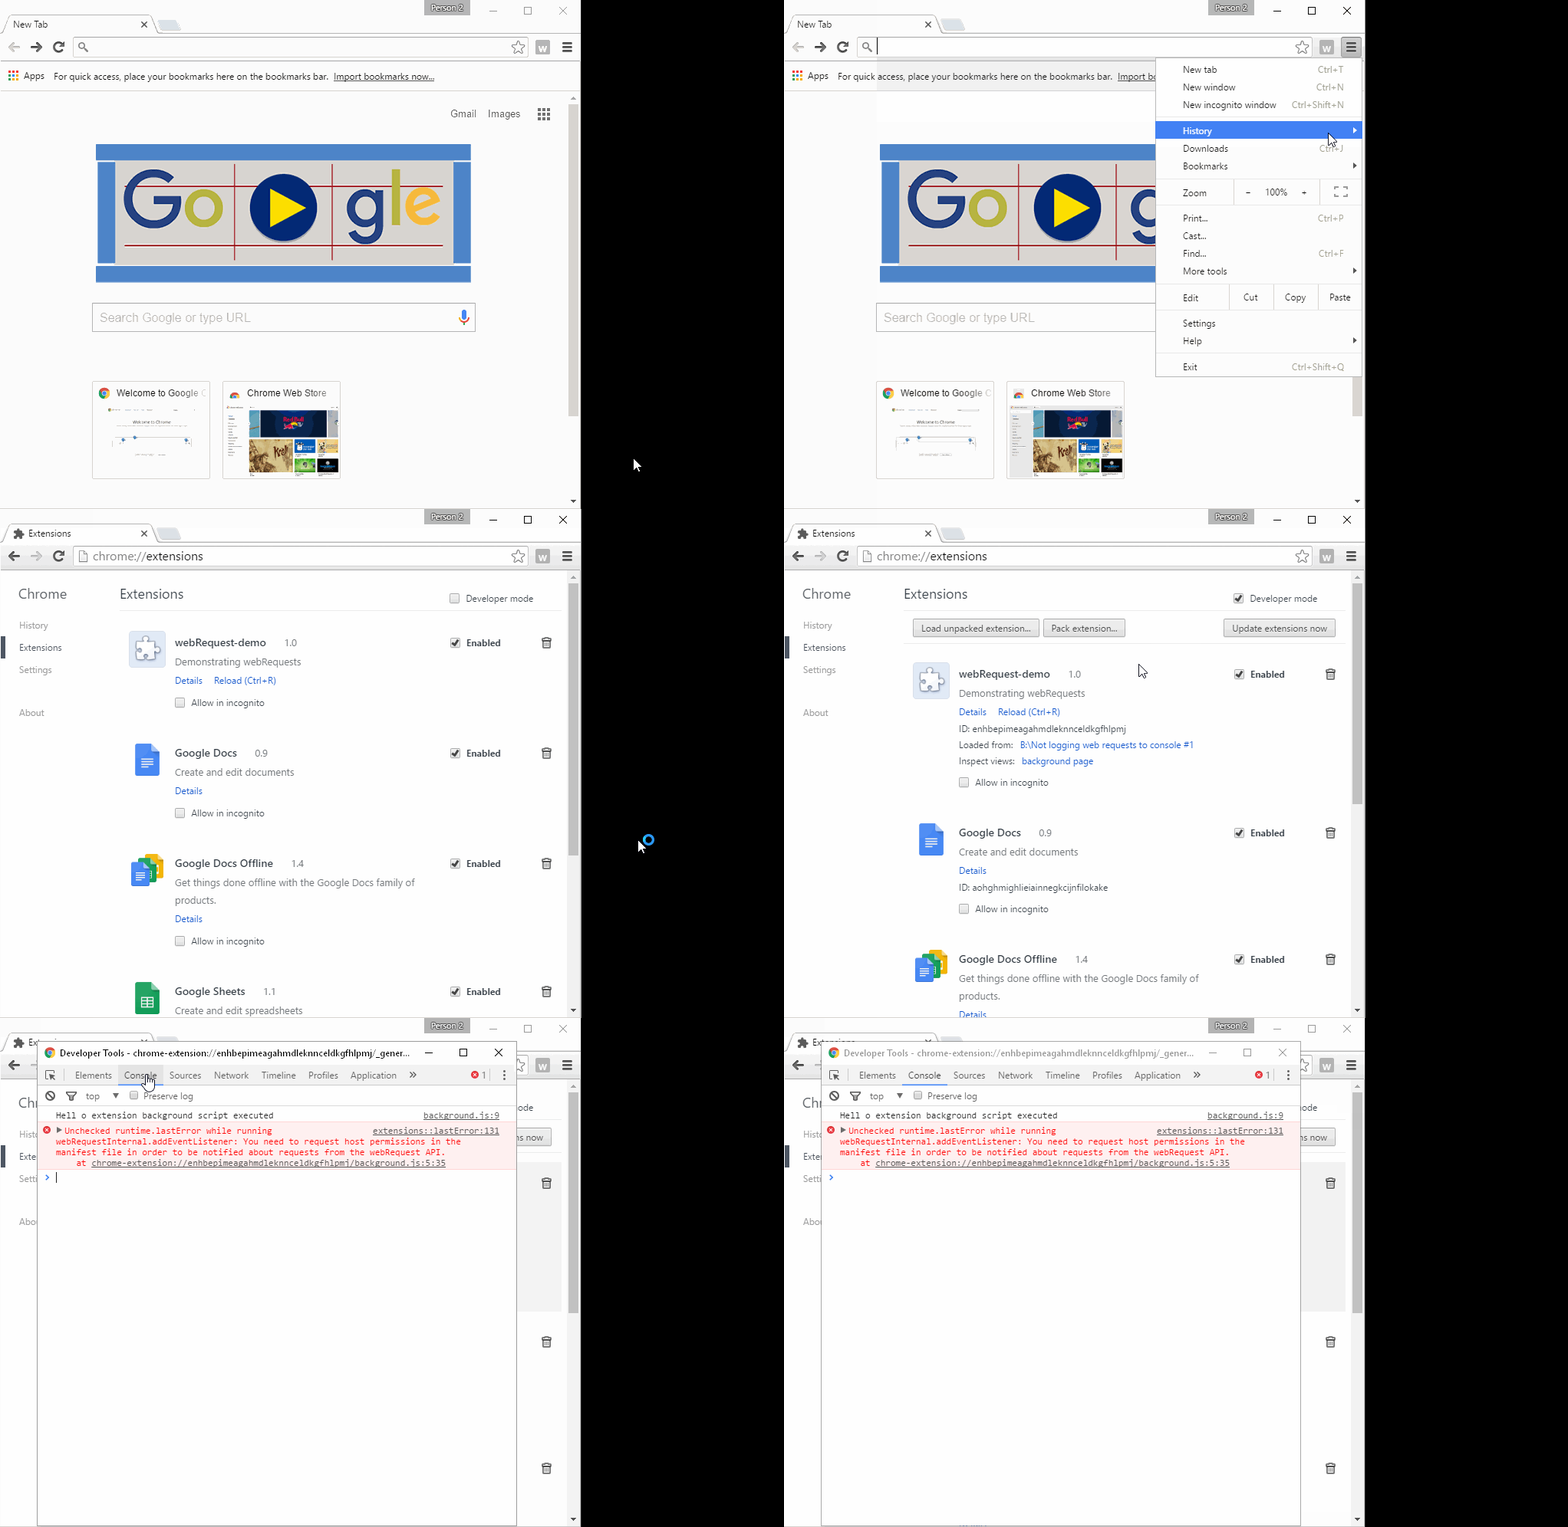
    As explained here, you have to go through multiple selections on a drop-down menu, to get to the chrome://extensions page (or you can type that in by hand as the URL, or use a bookmark) then select both a checkbox ("Developer mode") and then click on the "background page" link. Then, you have to select the "Console" tab on the window that pops up.

    It is much easier to show what you have to do:
    Show console for extension on Google Chrome

  • Content Scripts

    Output will be shown in the regular web console (in the web Developer Tools). You can open it by pressing F12 (or other shortcuts) in the webpage in which your content script was injected. Each web console will only show the output from the scripts injected in that tab.

    Doing the above with show the console.* output from your extension, but will result in the console JavaScript command line, debugger, etc. being in the context of the page, not the content script.

    If you want to use the console JavaScript command line in the context of the content scripts which are injected into a web page, you need to select your extension's content script context from the drop-down menu in the upper left of the Console window. This drop-down menu will normally start with the value "top". The drop down will have selections for each of the content script contexts (one per extension that has script(s) injected).

  • Popup (built-in)

    Right-click on your browserAction button and select "Inspect Popup". Alternatively, right-click within the popup and select "Inspect". Either will open the DevTools for the popup page. The popup will be kept open under more conditions than it normally would, but will still be closed if you switch tabs, etc.

  • Options

    Right-click within the main content of the Options popup (not the title bar) and select "Inspect". This will open the DevTools for the options page.

  • Devtools extension panel

    • Same as Options above: right-click inside + inspect.
    • In case your panel intercepts the right-click or in a bugged Chrome 97/98, open devtools-on-devtools, then use its picker button in the toolbar of the Elements panel (or press Ctrl-Shift-C on PC) to select your panel in the original devtools window.
  • Tab or popup (detached) with a page from your extension

    When a tab or a detached popup window is focused, you can open the DevTools by pressing F12 (or other shortcuts), or by opening the context menu (right-click) and selecting "Inspect".

    Note, the "detached popup" here means a window without an address bar, which is created using window.open or chrome.windows.create. There was another type called "panels", but it's no longer supported in modern Chrome.

Anthracite answered 12/8, 2016 at 14:58 Comment(0)
N
6

Which console are you viewing in for the logs?

If you are viewing console on a tab, then that is the wrong place.

Open settings / Extensions or in a new tab type

chrome://extensions

Under your extension click on "background page" link which is where you can watch for logs

**Make sure Developer mode is checked

Nonresident answered 12/8, 2016 at 9:0 Comment(0)
P
0

Yes for Chrome you have to click the background page link mentioned, but it won't be there unless you set it to be persistent:

"background": {
    "persistent": true,
    "scripts": ["background.js"]
}
Pulchritudinous answered 13/8, 2016 at 2:45 Comment(2)
This is not, necessarily, accurate. At least with the code exactly as in the question, when loaded using "Load unpackaged extension...", setting "persistent": true is not required to have the "background page" link showing.Anthracite
"persistent": true is not required for background page link to appear. "scripts": ["background.js"] is enough.Hyps

© 2022 - 2024 — McMap. All rights reserved.