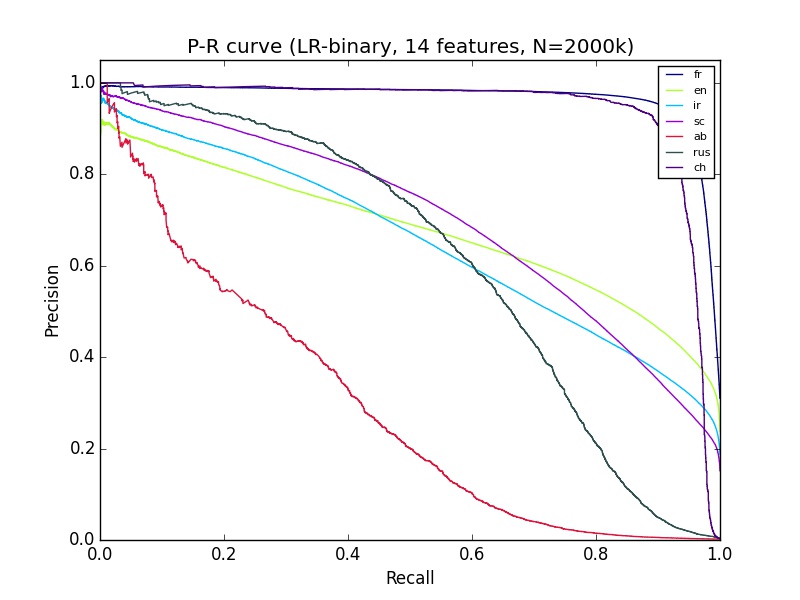
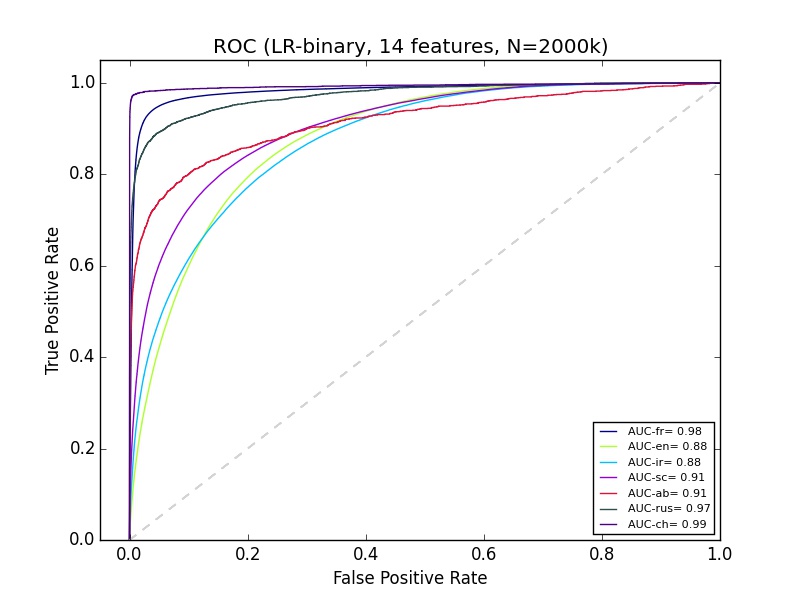
I have some machine learning results that I don't quite understand. I am using python sciki-learn, with 2+ million data of about 14 features. The classification of 'ab' looks pretty bad on the precision-recall curve, but the ROC for Ab looks just as good as most other groups' classification. What can explain that?
Good ROC curve but poor precision-recall curve
Is your set balanced? (ie. as many ab as non-ab) –
Rill
No it's very unbalanced, Ab is less than 2% –
Took
Here you go. Try oversampling to mitigate the issue. –
Rill
Class imbalance.
Unlike the ROC curve, PR curves are very sensitive to imbalance. If you optimize your classifier for good AUC on an unbalanced data you are likely to obtain poor precision-recall results.
I see, but what does it really mean in terms of the performance of the test? Is it good (based on ROC) or bad (based on P-R)? How can a test be good if in the above P-R curve that the best it can do is 40% for both precision and recall? –
Took
It means that you have to be careful when you report the performance of a test on unbalanced data. In medical applications it can have a terrible impact (see AIDS testing as a textbook case), in others it can be fine, it really depends on your specific application. –
Rill
I didn't tweak the default setting as I am using scikit learn, but like you said it seems to optimize based on AUC, is there a way to optimize based on Precision/recall pair in unbalanced data? –
Took
You should post this as a new question. –
Rill
© 2022 - 2024 — McMap. All rights reserved.


