Pandas DataFrame styler HTML display without index?
Asked Answered
T

5

11

I have a pandas dataframe, I'm using the df.style object to make it highlight odd-numbered rows, so:

def highlight_oddRow(s):
    return ['background-color: yellow' if s.name % 2 else '' for v in s]

table = pd.DataFrame(
    {'a': [3,9,8,0,2], 'b': [5,95, 9, 25,5], 'c': [23,54, 2, 3,5], 'row': [1, 2, 3, 4, 5]})

with open ('out.html','w') as out:
    print >> out, table.style.apply(highlight_oddRow, axis=1).render()

However, this always prints out the index. Is there a way to tell it not to do this?

Tacita answered 15/3, 2017 at 14:48 Comment(0)
I
7

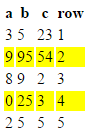
I looked through the source code for pandas.formats.style.Styler, and couldn't find a super-easy way to do it. So instead here is a hacky way. Basically I tell the CSS for the table to not display elements with class row_heading and the top left empty box, which has classes blank level0.

import pandas as pd

def highlight_oddRow(s):
    return ['background-color: yellow' if s.name % 2 else '' for v in s]

table = pd.DataFrame(
    {'a': [3,9,8,0,2], 'b': [5,95, 9, 25,5], 'c': [23,54, 2, 3,5], 'row': [1, 2, 3, 4, 5]})

with open ('out.html','w') as out:
    # Get the styler for the table
    styler = table.style

    # Set the display to none for row headings, and the blank box in the top left corner for the column headings
    styler.set_table_styles(
        [{'selector': '.row_heading',
          'props': [('display', 'none')]},
         {'selector': '.blank.level0',
          'props': [('display', 'none')]}])

    print >> out, styler.apply(highlight_oddRow, axis=1).render()

The result:

enter image description here

Idiom answered 15/3, 2017 at 16:37 Comment(0)
G
21

Since this is the first question that popped up when I searched for this issue on Stack Overflow, I thought it would be good to share a recent development: on Nov-17 a PR was committed to the pandas repo that added the hide_index method to styler objects.

You can just call it before render:

def highlight_oddRow(s):
    return ['background-color: yellow' if s.name % 2 else '' for v in s]

table = pd.DataFrame(
    {'a': [3,9,8,0,2], 'b': [5,95, 9, 25,5], 'c': [23,54, 2, 3,5], 'row': [1, 2, 3, 4, 5]})

with open ('out.html','w') as out:
    print >> out, table.style.apply(highlight_oddRow, axis=1).hide_index().render()

Keep in mind the docs still claim these features are provisional and subject to change. More info here: https://pandas.pydata.org/pandas-docs/stable/style.html#Hiding-the-Index-or-Columns.

Galvez answered 15/6, 2018 at 18:39 Comment(0)
S
13

This can be done by using the hide_index() method such as below

print >> out, table.style.hide_index().apply(highlight_odd_row, axis=1).render()
Superinduce answered 28/2, 2019 at 12:42 Comment(0)
I
7

I looked through the source code for pandas.formats.style.Styler, and couldn't find a super-easy way to do it. So instead here is a hacky way. Basically I tell the CSS for the table to not display elements with class row_heading and the top left empty box, which has classes blank level0.

import pandas as pd

def highlight_oddRow(s):
    return ['background-color: yellow' if s.name % 2 else '' for v in s]

table = pd.DataFrame(
    {'a': [3,9,8,0,2], 'b': [5,95, 9, 25,5], 'c': [23,54, 2, 3,5], 'row': [1, 2, 3, 4, 5]})

with open ('out.html','w') as out:
    # Get the styler for the table
    styler = table.style

    # Set the display to none for row headings, and the blank box in the top left corner for the column headings
    styler.set_table_styles(
        [{'selector': '.row_heading',
          'props': [('display', 'none')]},
         {'selector': '.blank.level0',
          'props': [('display', 'none')]}])

    print >> out, styler.apply(highlight_oddRow, axis=1).render()

The result:

enter image description here

Idiom answered 15/3, 2017 at 16:37 Comment(0)
A
1

The documentation states that the hide_index method has been:

Deprecated since version 1.4.0: This method should be replaced by hide(axis="index", **kwargs)

The code is self-explanatory - it hides the indices. So, an updated solution for this question is:

def highlight_oddRow(s):
    return ['background-color: yellow' if s.name % 2 else '' for v in s]

table = pd.DataFrame({
    'a': [3,9,8,0,2],
    'b': [5,95, 9, 25,5],
    'c': [23,54, 2, 3,5],
    'row': [1, 2, 3, 4, 5]
})

with open("out.html", "w") as out:
    out.write(table.style
              .apply(highlight_oddRow, axis=1)
              .hide(axis="index")  # `hide_index()` was deprecated
              .to_html())          # `render()` was also deprecated
Antipode answered 11/9, 2023 at 10:26 Comment(0)
E
0

Maybe a cheat way of doing this, but you could always set one of the other columns of your dataframe as the index? e.g. DataFrame.set_index('a')

Erythro answered 11/7, 2022 at 7:2 Comment(1)
Your answer could be improved with additional supporting information. Please edit to add further details, such as citations or documentation, so that others can confirm that your answer is correct. You can find more information on how to write good answers in the help center.Acyclic

© 2022 - 2025 — McMap. All rights reserved.