Boundary enclosing a given set of points
Asked Answered
C

5

15

I am having a bit of a problem with an algorithm that I am currently using. I wanted it to make a boundary.

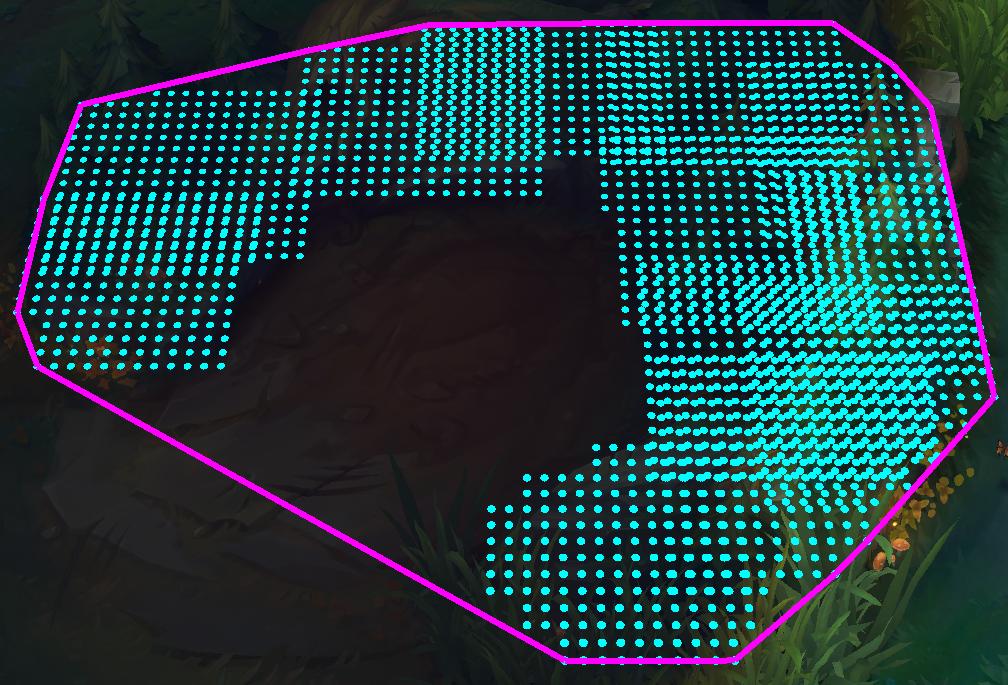
Here is an example of the current behavior:

Current behavior

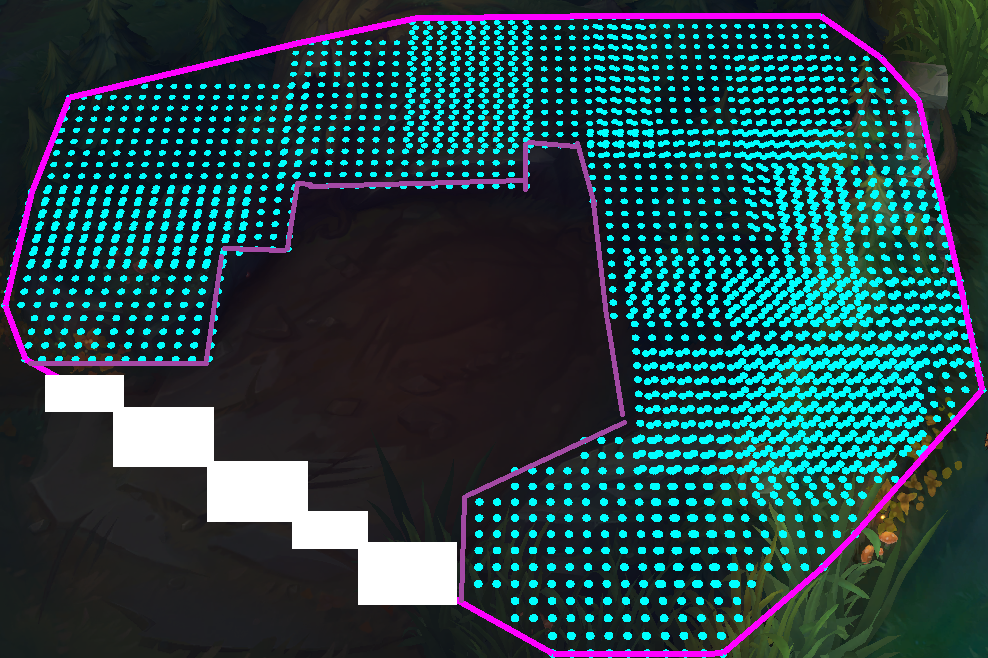
Here is an MSPaint example of wanted behavior:

Wanted behavior

Current code of Convex Hull in C#:https://hastebin.com/dudejesuja.cs

So here are my questions:

1) Is this even possible?

R: Yes

2) Is this even called Convex Hull? (I don't think so)

R: Nope it is called boundary, link: https://www.mathworks.com/help/matlab/ref/boundary.html

3) Will this be less performance friendly than a conventional convex hull?

R: Well as far as I researched it should be the same performance

4) Example of this algorithm in pseudo code or something similar?

R: Not answered yet or I didn't find a solution yet

Colfin answered 27/5, 2018 at 4:56 Comment(13)
1. Indeed this is not a convex hull. Convex hull would have no convexity, i.e., no parts that cave in. It would just be the exterior four points. 2. I don't understand what you actually want. Why are just those two points in the middle the ones you chose? Why not any of the other points? This may make more sense to you in your actual use case, but as far as connecting the dots go in this example, your choice seems completely arbitrary. Why use 6 points instead of 5 like the left? Why not 4 points like a true convex hull would?Moeller
@AlexanderReynolds Yes i am sorry, i drew it wrongly, and it was a bad example, i re did the example, i think this one is better, and you can imagine countless (not infinity), inside of the lines that i did, i would like to have that curve it does on right image.Hypervitaminosis
The updated image on the left does look like a true convex hull FWIW. For a better explanation of why I say your drawing is arbitrary: on the right, you want to curve a bit inwards instead of hitting the furthest point out. You seem to do this arbitrarily though. You skip some points, but don't skip others. What's the rule that you use? (I understand you're doing this "visually" to try to highlight what you want, but I'm trying to show that you're just arbitrarily selecting things, no program will do this for you unless you can devise a set of rules)Moeller
Like why isn't your drawing on the right this instead: imgur.com/a/Ot9W9d9 ? Of course you can continue to apply this same idea to other points. Do you actually start with anything OTHER than points in this process, or is truly the only info you have these points? Just trying to make sure this isn't an XY problem. What I would try to do if I were you is draw connections between every vertex (make a complete graph). Then start removing the exterior lines you don't want, and see if that follows a rule you can use.Moeller
@AlexanderReynolds Yes, i am sorry again, still new to this, in my head it makes sense, but i cant put it into words, trying to get better, hope this isnt a XY problem, and the example now may be much better than the first ones, and thanks for trying to help out.Hypervitaminosis
It looks like you maybe want a contour, but that would be hard to define on discrete points like that. However, whatever rule that made the points may be able to help make the contours. Where do those points come from in the image? Also again just to be clear---I know it's not what you want---but your title and question (minimum convex hull) is what you are getting in the first image, so what you want is not a convex hull.Moeller
@AlexanderReynolds Well this is just an example, but this is the reasoning on why those points were chosen. i am making a grid based game (NavMesh i believe it is called), and i want to get all the grid cells that are Walls and are not Ground, to make a contour around the object, like you said.Hypervitaminosis
So I don't know how to answer your question because I'm unsure exactly what you have as inputs and outputs. However, the Matlab function boundary() seems to get more towards what you want than a convex hull. This answer on SO about how it works may help as well: https://mcmap.net/q/671669/-what-algorithm-does-matlab-39-s-boundary-function-use. Hopefully this can get you in a better direction. Good luck!Moeller
@AlexanderReynolds Yes thanks, it should be boundary like that, will edit the post, maybe it will help someone later onHypervitaminosis
Look for alpha shapesLandlordism
@MárioGabriel yes, as MBo mentions: Google for “alpha shapes” or “concave hull”: gis.stackexchange.com/questions/1200/…Surfperch
I recently wrote a C++ library and code project article that does concave hull without alpha-shapes.Hollis
These packages should get the job done: pypi.org/project/alphashape or plotly.com/python/v3/alpha-shapesStrangles
S
31

Here is some Python code that computes the alpha-shape (concave hull) and keeps only the outer boundary. This is probably what matlab's boundary does inside.

from scipy.spatial import Delaunay
import numpy as np


def alpha_shape(points, alpha, only_outer=True):
    """
    Compute the alpha shape (concave hull) of a set of points.
    :param points: np.array of shape (n,2) points.
    :param alpha: alpha value.
    :param only_outer: boolean value to specify if we keep only the outer border
    or also inner edges.
    :return: set of (i,j) pairs representing edges of the alpha-shape. (i,j) are
    the indices in the points array.
    """
    assert points.shape[0] > 3, "Need at least four points"

    def add_edge(edges, i, j):
        """
        Add an edge between the i-th and j-th points,
        if not in the list already
        """
        if (i, j) in edges or (j, i) in edges:
            # already added
            assert (j, i) in edges, "Can't go twice over same directed edge right?"
            if only_outer:
                # if both neighboring triangles are in shape, it's not a boundary edge
                edges.remove((j, i))
            return
        edges.add((i, j))

    tri = Delaunay(points)
    edges = set()
    # Loop over triangles:
    # ia, ib, ic = indices of corner points of the triangle
    for ia, ib, ic in tri.vertices:
        pa = points[ia]
        pb = points[ib]
        pc = points[ic]
        # Computing radius of triangle circumcircle
        # www.mathalino.com/reviewer/derivation-of-formulas/derivation-of-formula-for-radius-of-circumcircle
        a = np.sqrt((pa[0] - pb[0]) ** 2 + (pa[1] - pb[1]) ** 2)
        b = np.sqrt((pb[0] - pc[0]) ** 2 + (pb[1] - pc[1]) ** 2)
        c = np.sqrt((pc[0] - pa[0]) ** 2 + (pc[1] - pa[1]) ** 2)
        s = (a + b + c) / 2.0
        area = np.sqrt(s * (s - a) * (s - b) * (s - c))
        circum_r = a * b * c / (4.0 * area)
        if circum_r < alpha:
            add_edge(edges, ia, ib)
            add_edge(edges, ib, ic)
            add_edge(edges, ic, ia)
    return edges

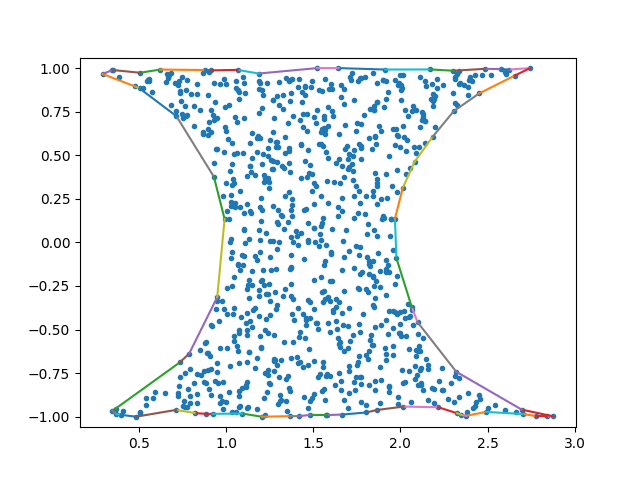
If you run it with the following test code you will get this figure, which looks like what you need: enter image description here

from matplotlib.pyplot import *

# Constructing the input point data
np.random.seed(0)
x = 3.0 * np.random.rand(2000)
y = 2.0 * np.random.rand(2000) - 1.0
inside = ((x ** 2 + y ** 2 > 1.0) & ((x - 3) ** 2 + y ** 2 > 1.0)
points = np.vstack([x[inside], y[inside]]).T

# Computing the alpha shape
edges = alpha_shape(points, alpha=0.25, only_outer=True)

# Plotting the output
figure()
axis('equal')
plot(points[:, 0], points[:, 1], '.')
for i, j in edges:
    plot(points[[i, j], 0], points[[i, j], 1])
show()

EDIT: Following a request in a comment, here is some code that "stitches" the output edge set into sequences of consecutive edges.

def find_edges_with(i, edge_set):
    i_first = [j for (x,j) in edge_set if x==i]
    i_second = [j for (j,x) in edge_set if x==i]
    return i_first,i_second

def stitch_boundaries(edges):
    edge_set = edges.copy()
    boundary_lst = []
    while len(edge_set) > 0:
        boundary = []
        edge0 = edge_set.pop()
        boundary.append(edge0)
        last_edge = edge0
        while len(edge_set) > 0:
            i,j = last_edge
            j_first, j_second = find_edges_with(j, edge_set)
            if j_first:
                edge_set.remove((j, j_first[0]))
                edge_with_j = (j, j_first[0])
                boundary.append(edge_with_j)
                last_edge = edge_with_j
            elif j_second:
                edge_set.remove((j_second[0], j))
                edge_with_j = (j, j_second[0])  # flip edge rep
                boundary.append(edge_with_j)
                last_edge = edge_with_j

            if edge0[0] == last_edge[1]:
                break

        boundary_lst.append(boundary)
    return boundary_lst

You can then go over the list of boundary lists and append the points corresponding to the first index in each edge to get a boundary polygon.

Stray answered 6/6, 2018 at 7:13 Comment(13)
Nice to have some code as an answer. Note that this will get slower and slower as edges gets added.Hollis
I'm not sure, since edges is a set and an edge gets visited at most twice, I think the runtime will be dominated by the O(n log n) of constructing the Delaunay triangulation. The plotting code isn't efficient though..Stray
Have any of you guys tried to convert the output outline lines into shapefiles polygons; possibly trough shapely? I've been trying unsuccesfully so far. Appreciate any guidance on this respect.Leiker
I edited the answer to add code that stitches the edge set to boundary polygons. The general idea is to append consecutive edges to the end of the chain until it closes the polygon. Hope this helps.Stray
This is really useful code - thanks! I am trying to adapt it to find the concave hull of the following data 'x =( 1.0, 907.0, 908.0, 1052.0, 1118.0, 1214.0, 1220.0, 1344.0, 1494.0, 1507.0, 1623.0, 1818.0, 2033.0, 2063.0, 2070.0, 2464.0, 2464.9) y = (4035.0, 3933.6, 3634.6, 3211.4, 3296.2, 2684.1, 2861.1, 2753.3, 2653.0, 2810.0, 2597.3, 2054.9, 2287.0, 2048.7, 2182.6, 1892.0, 1827.0)' and create the points array using 'points = np.vstack( ( x, y ) ).T' but 'alpha_shape' returns an empty list. Any thoughts?Kabyle
I believe you may be using a value of alpha that is too small. Your points are relatively far off, so I tried with values of alpha=1000 and alpha=2500 and got the expected results.Stray
Hi Iddo - thank you! Playing around with alpha gave just the result I was hoping farKabyle
Is it possible to convert the values of edges to longitude and latitude again?Galloon
The edges are indices (i, j) in the original points array, so (points[i, [0, 1]], points[j, [0,1]]) is the edge segment in the original coordinates.Stray
Does anyone know how to estimate the total area wrapped by the hull? I have a set of lat & lon points and want to check thatKeli
@Victor Aguiar - see for example this answer https://mcmap.net/q/102333/-how-do-i-calculate-the-area-of-a-2d-polygon-duplicate for computing the area of a 2d polygonStray
@IddoHanniel Is there any way to make the algorithm working if there are more than 1 blob of points?Zonazonal
@Zonazonal The algorithm returns a list of lists each representing a boundary. Therefore, if there are more than one blob (and assuming the alpha value is small enough so that they are not united) the list will contain more than one boundary.Stray
C
2

I would use a different approach to solve this problem. Since we are working with a 2-D set of points, it is straightforward to compute the bounding rectangle of the points’ region. Then I would divide this rectangle into “cells” by horizontal and vertical lines, and for each cell simply count the number of pixels located within its bounds. Since each cell can have only 4 adjacent cells (adjacent by cell sides), then the boundary cells would be the ones that have at least one empty adjacent cell or have a cell side located at the bounding rectangle boundary. Then the boundary would be constructed along boundary cell sides. The boundary would look like a “staircase”, but choosing a smaller cell size would improve the result. As a matter of fact, the cell size should be determined experimentally; it could not be too small, otherwise inside the region may appear empty cells. An average distance between the points could be used as a lower boundary of the cell size.

Crescendo answered 29/5, 2018 at 2:59 Comment(1)
What you are describing is called a quad-tree.Nolpros
N
1

Consider using an Alpha Shape, sometimes called a Concave Hull. https://en.wikipedia.org/wiki/Alpha_shape

It can be built from the Delaunay triangulation, in time O(N log N).

Nolpros answered 29/5, 2018 at 12:7 Comment(0)
O
1

As pointed out by most previous experts, this might not be a convex hull but a concave hull, or an Alpha Shape in other words. Iddo provides a clean Python code to acquire this shape. However, you can also directly utilize some existing packages to realize that, perhaps with a faster speed and less computational memory if you are working with a large number of point clouds.

[1] Alpha Shape Toolbox: a toolbox for generating n-dimensional alpha shapes.

https://plotly.com/python/v3/alpha-shapes/

[2] Plotly: It can can generate a Mesh3d object, that depending on a key-value can be the convex hull of that set, its Delaunay triangulation, or an alpha set.

https://plotly.com/python/v3/alpha-shapes/

Outlive answered 18/1, 2022 at 8:57 Comment(0)
B
0

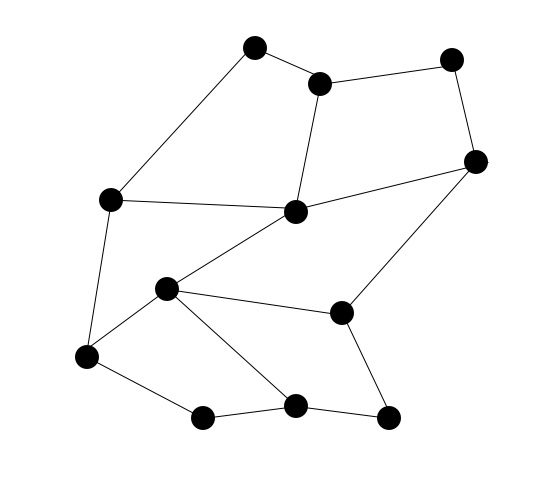
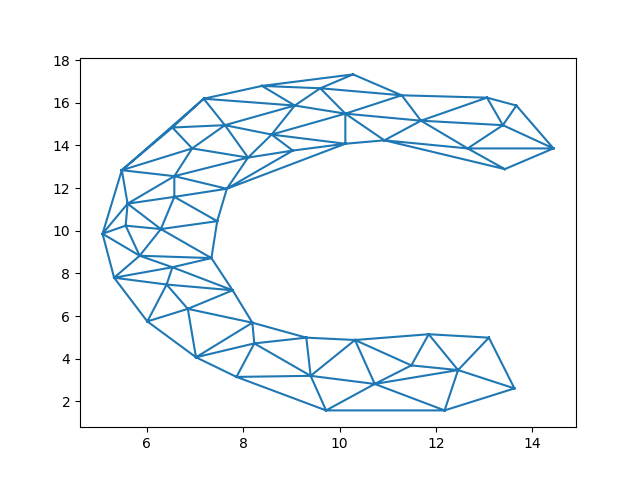
One idea is creating triangles, a mesh, using the point cloud, perhaps through Delanuay triangulation,

enter image description here

and filling those triangles with a color then run level set, or active contour segmentation which will find the outer boundary of the shape whose color is now different then the outside "background" color.

https://xphilipp.developpez.com/contribuez/SnakeAnimation.gif

The animation above did not go all the way but many such algorithms can be configured to do that.

Note: The triangulation alg has to be tuned so that it doesn't merely create a convex hull - for example removing triangles with too large angles and sides from the delanuay result. A prelim code could look like

from scipy.spatial import Delaunay

points = np.array([[13.43, 12.89], [14.44, 13.86], [13.67, 15.87], [13.39, 14.95],\
[12.66, 13.86], [10.93, 14.24], [11.69, 15.16], [13.06, 16.24], [11.29, 16.35],\
[10.28, 17.33], [10.12, 15.49], [9.03, 13.76], [10.12, 14.08], [9.07, 15.87], \
[9.6, 16.68], [7.18, 16.19], [7.62, 14.95], [8.39, 16.79], [8.59, 14.51], \
[8.1, 13.43], [6.57, 11.59], [7.66, 11.97], [6.94, 13.86], [6.53, 14.84], \
[5.48, 12.84], [6.57, 12.56], [5.6, 11.27], [6.29, 10.08], [7.46, 10.45], \
[7.78, 7.21], [7.34, 8.72], [6.53, 8.29], [5.85, 8.83], [5.56, 10.24], [5.32, 7.8], \
[5.08, 9.86], [6.01, 5.75], [6.41, 7.48], [8.19, 5.69], [8.23, 4.72], [6.85, 6.34], \
[7.02, 4.07], [9.4, 3.2], [9.31, 4.99], [7.86, 3.15], [10.73, 2.82], [10.32, 4.88], \
[9.72, 1.58], [11.85, 5.15], [12.46, 3.47], [12.18, 1.58], [11.49, 3.69], \
[13.1, 4.99], [13.63, 2.61]])

tri = Delaunay(points,furthest_site=False)
res = []
for t in tri.simplices:
  A,B,C = points[t[0]],points[t[1]],points[t[2]]
  e1 = B-A; e2 = C-A
  num = np.dot(e1, e2)
  n1 = np.linalg.norm(e1); n2 = np.linalg.norm(e2)
  denom =  n1 * n2
  d1 = np.rad2deg(np.arccos(num/denom))
  e1 = C-B; e2 = A-B
  num = np.dot(e1, e2)
  denom = np.linalg.norm(e1) * np.linalg.norm(e2)
  d2 = np.rad2deg(np.arccos(num/denom))
  d3 = 180-d1-d2
  res.append([n1,n2,d1,d2,d3])

res = np.array(res)
m = res[:,[0,1]].mean()*res[:,[0,1]].std()

mask = np.any(res[:,[2,3,4]] > 110) & (res[:,0] < m) & (res[:,1] < m )

plt.triplot(points[:,0], points[:,1], tri.simplices[mask])

enter image description here

Then fill with color and segment.
Boatbill answered 17/8, 2022 at 19:53 Comment(0)

© 2022 - 2024 — McMap. All rights reserved.