How to apply a clipping mask to geom in a ggplot?
Asked Answered
H

2

9

I am trying to apply a clipping mask to a geom from a ggplot to mask part of the data, but keep the axis, the grid, other geoms and the legend visible. I do not want to create a specific plot, and therefore I am not looking for a work-around with polygons masking some parts of the plot.

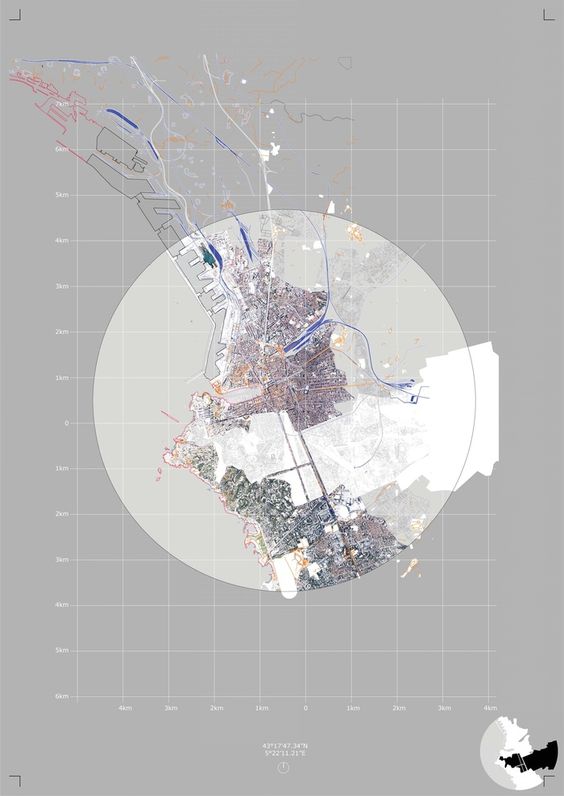
This is the kind of design I would like to emulate (the mask, not necessarily theme, I now how to do that):

map with a central round clipping mask on some layers

(source)

See also this example

One could argue that I could filter the data that is not contained in the polygon that defines the mask. But, while it works for point, and can work for polygon/line-like objects, it does for rasters (the border would not exactly follow non-vertical or non-horizontal lines). So I tried the following:

library(ggplot2)
library(gridSVG)
library(grImport)

# Create a plot
p <- ggplot(diamonds[1:300,], aes(carat, price)) + geom_point(aes(colour = cut))

# And a clipping mask
pg <- polygonGrob(c(.7, 0, 0, 1, 1),
              c(0, .7, 1, 1, 0))
cp <- clipPath(pg)

I was able to use the packages gridSVG to define a clipping mask, but I have difficulties applying it on a ggplot object, even after extracting the grob (see resource here) with ggplotGrob(). I was not able to apply the clipping mask to the grob:

g <-  ggplotGrob(p) # store the plot as a grob

registerClipPath("mask", cp)
g_clipped <- clipPath(g)

gridsvg(name = "test_c2.svg")
grid.draw(clipPathGrob(g_clipped, cp)$grob)
dev.off()

My intuition was that the g_clipped should be plotted, but I couldn't grid.draw() it, since its a clipPath object. And the grid.draw() line written here show the plot not masked. I think I don't quite grasp how the clipPath objects function.

The function grobify() sounds like it could help for an alternative appraoch without gridSVG, see details here, but I do not understand the quite minimalistic documentation.

Since I cannot even apply the clipping mask to the whole plot, I am far for my objective.

If you can help me understand how to apply the clipping mask from gridSVGor have an alternative solution to apply a clipping mask to specific geoms, please let me know.

Heady answered 6/8, 2018 at 21:30 Comment(0)
B
2

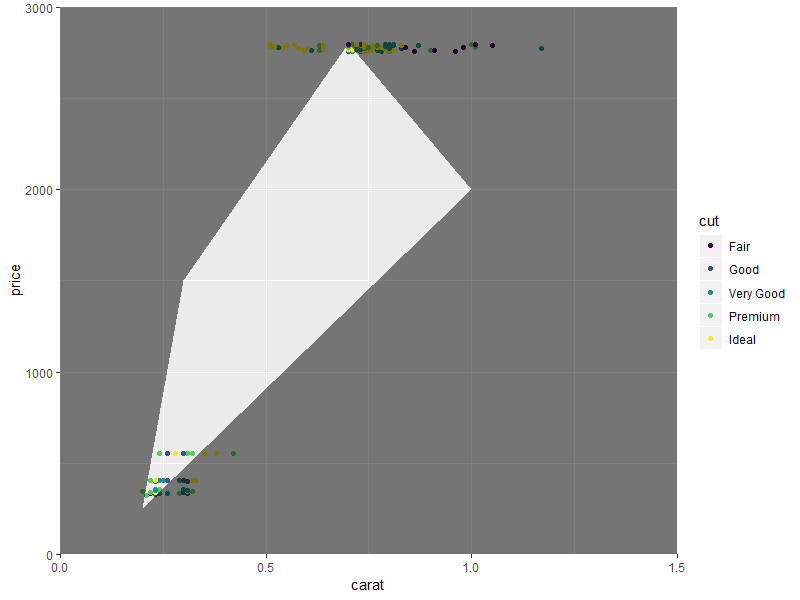
The following is a grid solution, but very much a work-around. It shows how to apply a non-rectangular clipping region to a ggplot, so that one set of points in your plot is clipped. You weren't too far wrong in your attempt. A couple of points to note:

  1. You need to grid.force() the ggplotGrob object so the grid can see the grobs.
  2. Do not define the ggplot grob as a clipping path - the clipping path is the polygon.
  3. The clipping path is applied to the points grob within the plot panel of the ggplot. This means that other objects in the plot panel, the panel background and grid lines, do not get clipped. Only the data points are clipped.

I've added a blue line to the plot to show that the line too does not need to be clipped; but can be clipped if desired.

There are also commented lines of code that, when uncommented, will draw the clipping region, and move the grid lines and points to the front (that is, in front of the darker grey clipping region).

library(ggplot2)
library(gridSVG)
library(grid)

# Open the graphics device
gridsvg(name = "test.svg")

# Create a plot
p <- ggplot(diamonds[1:300, ], aes(carat, price)) + 
       geom_point(aes(colour = cut)) +
       geom_line(data = data.frame(x = c(.3, .9), y = c(500, 2500)), aes(x,y), col = "skyblue", size = 2)
g <- ggplotGrob(p) # Store the plot as a grob


g = grid.force(g)  # So that grid sees all grobs
grid.draw(g)       # Draw the plot

# Define the clipping path
pg <- polygonGrob(c(.7, 0, 0, 1, 1),
                  c(0, .7, 1, 1, 0))
# The clipping path can be nearly any shape you desire. 
# Try this for a circular region
# pg = circleGrob(x = .5, y = .6, r = .5)
cp <- clipPath(pg)

# Add the clipping path to the points grob.
# That is, only the points inside the polygon will be visible,
# but the background and grid lines will not be clipped. 
# Nor will the blue line be clipped.
# grid.ls(g)     # names of the grobs
seekViewport(grep("panel.[0-9]", grid.ls(g)$name, value = TRUE))
grid.clipPath("points", cp, grep = TRUE)   

# To clip the blue line, uncomment the next line
# grid.clipPath("GRID.polyline", cp, grep = TRUE)       

# To show the clipping region,    
# uncomment the next two lines.
# showcp = editGrob(pg, gp = gpar(fill = rgb(0, 0, 0, 0.05), col = "transparent"))
# grid.draw(showcp)

# And to move the grid lines, remaining data points, and blue line in front of the clipping region,
# uncomment the next five lines
# panel = grid.get("panel", grep = TRUE)   # Get the panel, and remove the background grob
# panel = removeGrob(panel, "background", grep = TRUE)

# grid.remove("points", grep = TRUE)     # Remove points and grid lines from the rendered plot
# grid.remove("line", grep = TRUE, global = TRUE)

# grid.draw(panel)     # Draw the edited panel - on top of the clipping region 


# Turn off the graphics device
dev.off()

# Find text.svg in your working directory


Edit Defining the clipping region using the coordinate system in which the data points were drawn.

library(ggplot2)
library(gridSVG)
library(grid)

# Open the graphics device
gridsvg(name = "test.svg")

# Create a plot
p <- ggplot(diamonds[1:300, ], aes(carat, price)) + 
       geom_point(aes(colour = cut)) +
       geom_line(data = data.frame(x = c(.3, .9), y = c(500, 2500)), aes(x,y), col = "skyblue", size = 2)
g <- ggplotGrob(p) # Store the plot as a grob


g = grid.force(g)  # So that grid sees all grobs
grid.draw(g)       # Draw the plot

# Get axis limits (including any expansion)
axis.limits = summarise_layout(ggplot_build(p))[1, c('xmin', 'xmax', 'ymin', 'ymax')]

# Find the 'panel' viewport,
# then push to a new viewport, 
# one that exactly overlaps the 'panel' viewport,
# but with limits on the x and y scales that are the same
# as the limits for the original ggplot. 
seekViewport(grep("panel.[0-9]", grid.ls(g)$name, value = TRUE))
pushViewport(dataViewport(xscale = axis.limits[1, 1:2],
                          yscale = axis.limits[1, 3:4]))

# Define the clipping path
 pg <- polygonGrob(x = c(.6,   0.3, .3,   .8,   1.2), 
                   y = c(500, 1500, 2900, 2900, 1500), 
                   default.units="native")
cp <- clipPath(pg)

# Add the clipping path to the points grob.
# That is, only the points inside the polygon will be visible,
# but the background and grid lines will not be clipped. 
# Nor will the blue line be clipped.
# grid.ls(g)     # names of the grobs

grid.clipPath("points", cp, grep = TRUE)   

# To clip the blue line, uncomment the next line
 grid.clipPath("GRID.polyline", cp, grep = TRUE)       

# To show the clipping region. 
 showcp = editGrob(pg, gp = gpar(fill = rgb(0, 0, 0, 0.05), col = "transparent"))
 grid.draw(showcp)

# And to move the grid lines and remaining data points in front of the clipping region.
 panel = grid.get("panel", grep = TRUE)   # Get the panel, and remove the background grob
 panel = removeGrob(panel, "background", grep = TRUE)

 grid.remove("points", grep = TRUE)     # Remove points and grid lines from the rendered plot
 grid.remove("line", grep = TRUE, global = TRUE)

 grid.draw(panel)     # Draw the edited panel - on top of the clipping region 


# Turn off the graphics device
dev.off()

# Find text.svg in your working directory
Benkley answered 8/8, 2018 at 2:13 Comment(7)
Thank you for that answer, it makes things clearer and opens options. To be clear, the coordinates of the clipping polygon are in the viewport coordinate system? Also, by modifying the argument of the grep function, I could select the geoms I want (here your select all elements of the panel, therefore all geoms?)?Heady
1st question. The coordinate are in "npc" units: (0,0) is the bottom left corner, (1,1) is top right corner. But it is possible to define the clipping region using the coordinates in which the data are plotted. I'll add an edit to show how that is done.Benkley
2nd question. Not quite. In grid, a viewport is a region in which grobs are drawn. I use a trick to select the viewport. The 'panel' viewport (i.e., the viewport in which all the panel grobs are drawn) has the same name as the 'panel' grob. I could have used current.vpTree() to get the viewport names, but is not set out well, and it is harder to extract the required viewport name.Benkley
2nd question continued. The seekViewport commend means that I move the the viewport in which all the panel grobs are drawn: grid.lines, background, data points, and the blue line. I haven't selected any grobs (or geoms) at this stage.Benkley
2nd question continued. grid.clipPath("points", cp, grep = TRUE) applies the clipping region to the points. The blue line remains intact. grid.clipPath("GRID.polyline", cp, grep = TRUE) would apply the clipping region to the line.Benkley
Where do "points" and "GRID.polyline" come from? grid.ls(g) gives the names of all the grobs in the ggplot. Look through the output to find something to do with "panel". The names of the points grob (i.e., the points geom in ggplot-speak) is 'geom_point.points.116' and the name of the line grob (i.e., the line geom) is 'GRID.polyline.117'. Unfortunately, the numbers change every time the plot is drawn. Using grep = TRUE means I can treat the name as a regular expression.Benkley
Thanks for all the useful information. I will look at tit later next week as I don't have much time now, and may come back to you if I have other question (and you don't mind answering them). You are of a great help. Thanks again.Heady
F
2

Since you are starting out with a ggplot object, it may be simpler to create the mask itself as a geom layer, rather than convert everything to grob and work in the grid system there.

The geom_polypath() function from the ggpolypath package can be used here. Unlike the standard geom_polygon in ggplot2, it is able to handle polygons with holes (see vignette):

# sample data frame for clipping. The first four x & y coordinates are for the outer ends;
# the next four are for the hole in the polygon.
clipping.df <- data.frame(x = c(0, 1.5, 1.5, 0, 0.2, 1, 0.7, 0.3),
                          y = c(0, 0, 3000, 3000, 250, 2000, 2800, 1500),
                          hole = rep(c(FALSE, TRUE), each = 4),
                          group = rep(c("1", "2"), each = 4))

library(ggpolypath)
p +
  geom_polypath(data = clipping.df,
                aes(x = x, y = y, group = group),
                colour = NA, fill = "black", alpha = 0.5,
                inherit.aes = FALSE) +
  scale_x_continuous(expand = c(0, 0)) + # don't show edges beyond the extent
  scale_y_continuous(expand = c(0, 0))   # of the polygon

plot

Free answered 7/8, 2018 at 1:26 Comment(3)
Thank you for the idea. It could work for some cases, however, it does not achieve what I am aiming for. The two main limitations of the approach are: (1) it masks the grid, (2) it masks every thin under the geom, while the clipping mask approach allows you to mask some layer, but not the layers below. I'll keep digind ;)Heady
Perhaps you can provide an example demonstrating your ideal output? As for your 1st concern, theme() has an option for panel.ontop, which places the grid over data layers.Free
Maybe this image represents better the interest of clipping masks (applied here on the grey areas). I didn't know that, so thank you. However, this is still not completely satisfactory as the grid would now overlap everything, while a clipping mask would allow to keep the geoms in front of the grid. Therefore, I am really looking for applying a clipping mask to a geom in a consistent and structured way, rather than a work-around to produce a specific one-shot plot.Heady
B
2

The following is a grid solution, but very much a work-around. It shows how to apply a non-rectangular clipping region to a ggplot, so that one set of points in your plot is clipped. You weren't too far wrong in your attempt. A couple of points to note:

  1. You need to grid.force() the ggplotGrob object so the grid can see the grobs.
  2. Do not define the ggplot grob as a clipping path - the clipping path is the polygon.
  3. The clipping path is applied to the points grob within the plot panel of the ggplot. This means that other objects in the plot panel, the panel background and grid lines, do not get clipped. Only the data points are clipped.

I've added a blue line to the plot to show that the line too does not need to be clipped; but can be clipped if desired.

There are also commented lines of code that, when uncommented, will draw the clipping region, and move the grid lines and points to the front (that is, in front of the darker grey clipping region).

library(ggplot2)
library(gridSVG)
library(grid)

# Open the graphics device
gridsvg(name = "test.svg")

# Create a plot
p <- ggplot(diamonds[1:300, ], aes(carat, price)) + 
       geom_point(aes(colour = cut)) +
       geom_line(data = data.frame(x = c(.3, .9), y = c(500, 2500)), aes(x,y), col = "skyblue", size = 2)
g <- ggplotGrob(p) # Store the plot as a grob


g = grid.force(g)  # So that grid sees all grobs
grid.draw(g)       # Draw the plot

# Define the clipping path
pg <- polygonGrob(c(.7, 0, 0, 1, 1),
                  c(0, .7, 1, 1, 0))
# The clipping path can be nearly any shape you desire. 
# Try this for a circular region
# pg = circleGrob(x = .5, y = .6, r = .5)
cp <- clipPath(pg)

# Add the clipping path to the points grob.
# That is, only the points inside the polygon will be visible,
# but the background and grid lines will not be clipped. 
# Nor will the blue line be clipped.
# grid.ls(g)     # names of the grobs
seekViewport(grep("panel.[0-9]", grid.ls(g)$name, value = TRUE))
grid.clipPath("points", cp, grep = TRUE)   

# To clip the blue line, uncomment the next line
# grid.clipPath("GRID.polyline", cp, grep = TRUE)       

# To show the clipping region,    
# uncomment the next two lines.
# showcp = editGrob(pg, gp = gpar(fill = rgb(0, 0, 0, 0.05), col = "transparent"))
# grid.draw(showcp)

# And to move the grid lines, remaining data points, and blue line in front of the clipping region,
# uncomment the next five lines
# panel = grid.get("panel", grep = TRUE)   # Get the panel, and remove the background grob
# panel = removeGrob(panel, "background", grep = TRUE)

# grid.remove("points", grep = TRUE)     # Remove points and grid lines from the rendered plot
# grid.remove("line", grep = TRUE, global = TRUE)

# grid.draw(panel)     # Draw the edited panel - on top of the clipping region 


# Turn off the graphics device
dev.off()

# Find text.svg in your working directory


Edit Defining the clipping region using the coordinate system in which the data points were drawn.

library(ggplot2)
library(gridSVG)
library(grid)

# Open the graphics device
gridsvg(name = "test.svg")

# Create a plot
p <- ggplot(diamonds[1:300, ], aes(carat, price)) + 
       geom_point(aes(colour = cut)) +
       geom_line(data = data.frame(x = c(.3, .9), y = c(500, 2500)), aes(x,y), col = "skyblue", size = 2)
g <- ggplotGrob(p) # Store the plot as a grob


g = grid.force(g)  # So that grid sees all grobs
grid.draw(g)       # Draw the plot

# Get axis limits (including any expansion)
axis.limits = summarise_layout(ggplot_build(p))[1, c('xmin', 'xmax', 'ymin', 'ymax')]

# Find the 'panel' viewport,
# then push to a new viewport, 
# one that exactly overlaps the 'panel' viewport,
# but with limits on the x and y scales that are the same
# as the limits for the original ggplot. 
seekViewport(grep("panel.[0-9]", grid.ls(g)$name, value = TRUE))
pushViewport(dataViewport(xscale = axis.limits[1, 1:2],
                          yscale = axis.limits[1, 3:4]))

# Define the clipping path
 pg <- polygonGrob(x = c(.6,   0.3, .3,   .8,   1.2), 
                   y = c(500, 1500, 2900, 2900, 1500), 
                   default.units="native")
cp <- clipPath(pg)

# Add the clipping path to the points grob.
# That is, only the points inside the polygon will be visible,
# but the background and grid lines will not be clipped. 
# Nor will the blue line be clipped.
# grid.ls(g)     # names of the grobs

grid.clipPath("points", cp, grep = TRUE)   

# To clip the blue line, uncomment the next line
 grid.clipPath("GRID.polyline", cp, grep = TRUE)       

# To show the clipping region. 
 showcp = editGrob(pg, gp = gpar(fill = rgb(0, 0, 0, 0.05), col = "transparent"))
 grid.draw(showcp)

# And to move the grid lines and remaining data points in front of the clipping region.
 panel = grid.get("panel", grep = TRUE)   # Get the panel, and remove the background grob
 panel = removeGrob(panel, "background", grep = TRUE)

 grid.remove("points", grep = TRUE)     # Remove points and grid lines from the rendered plot
 grid.remove("line", grep = TRUE, global = TRUE)

 grid.draw(panel)     # Draw the edited panel - on top of the clipping region 


# Turn off the graphics device
dev.off()

# Find text.svg in your working directory
Benkley answered 8/8, 2018 at 2:13 Comment(7)
Thank you for that answer, it makes things clearer and opens options. To be clear, the coordinates of the clipping polygon are in the viewport coordinate system? Also, by modifying the argument of the grep function, I could select the geoms I want (here your select all elements of the panel, therefore all geoms?)?Heady
1st question. The coordinate are in "npc" units: (0,0) is the bottom left corner, (1,1) is top right corner. But it is possible to define the clipping region using the coordinates in which the data are plotted. I'll add an edit to show how that is done.Benkley
2nd question. Not quite. In grid, a viewport is a region in which grobs are drawn. I use a trick to select the viewport. The 'panel' viewport (i.e., the viewport in which all the panel grobs are drawn) has the same name as the 'panel' grob. I could have used current.vpTree() to get the viewport names, but is not set out well, and it is harder to extract the required viewport name.Benkley
2nd question continued. The seekViewport commend means that I move the the viewport in which all the panel grobs are drawn: grid.lines, background, data points, and the blue line. I haven't selected any grobs (or geoms) at this stage.Benkley
2nd question continued. grid.clipPath("points", cp, grep = TRUE) applies the clipping region to the points. The blue line remains intact. grid.clipPath("GRID.polyline", cp, grep = TRUE) would apply the clipping region to the line.Benkley
Where do "points" and "GRID.polyline" come from? grid.ls(g) gives the names of all the grobs in the ggplot. Look through the output to find something to do with "panel". The names of the points grob (i.e., the points geom in ggplot-speak) is 'geom_point.points.116' and the name of the line grob (i.e., the line geom) is 'GRID.polyline.117'. Unfortunately, the numbers change every time the plot is drawn. Using grep = TRUE means I can treat the name as a regular expression.Benkley
Thanks for all the useful information. I will look at tit later next week as I don't have much time now, and may come back to you if I have other question (and you don't mind answering them). You are of a great help. Thanks again.Heady

© 2022 - 2024 — McMap. All rights reserved.