Find locale minimum in histogram (1D array) (Python)
Asked Answered
T

1

2

I have processed radar image and to detect water I have to find local minimum in the histogram. Histogram is little bit different for every area so I have to automatically find local minimum based on every histogram.

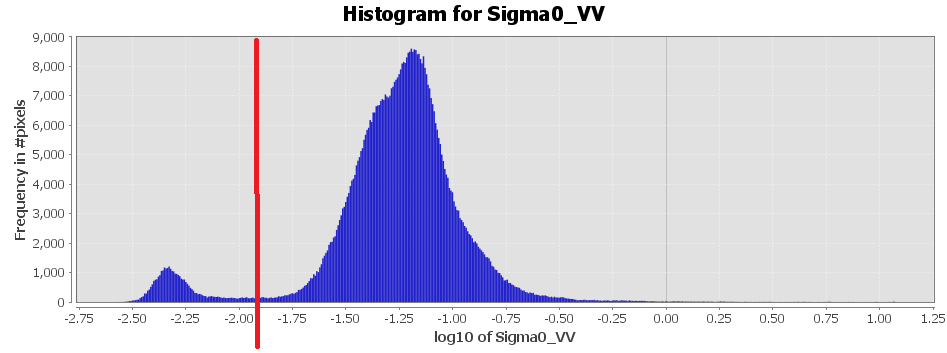
Histogram for Sigma0_VV

My input array is 1D array of image values (0.82154, 0.012211,...). I know how to create histogram in numpy and matplotlib but I do not know what should I do to determine locale minimum which is showed in the picture. I use python scipy libraries.

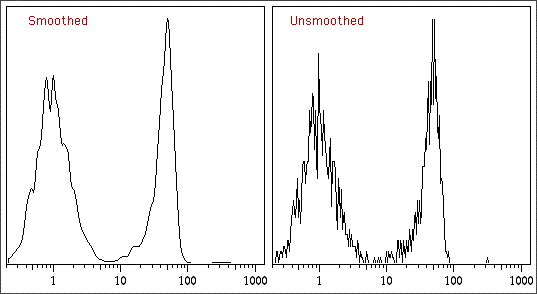
First step should be to smooth the histogram for easier determination of minimum, could you tell me what to use to smooth data ? Something like this:

Smoothed/Unsmoothed

Telethon answered 19/9, 2017 at 12:33 Comment(2)
Please include your images within the question, not as links to external sitesVibration
I could not inlude pictures because I am new and have not high enough reputation score. I uploaded pictures but system add them as links.Telethon
G
2

You can smooth the data with numpy with numpy.convolve() or you can use the following function:

import numpy

def smooth(x,window_len=11,window='hanning'):
    if x.ndim != 1:
        raise ValueError, "smooth only accepts 1 dimension arrays."

    if x.size < window_len:
        raise ValueError, "Input vector needs to be bigger than window size."


    if window_len<3:
        return x


    if not window in ['flat', 'hanning', 'hamming', 'bartlett', 'blackman']:
        raise ValueError, "Window is on of 'flat', 'hanning', 'hamming', 'bartlett', 'blackman'"


    s=numpy.r_[x[window_len-1:0:-1],x,x[-2:-window_len-1:-1]]
    #print(len(s))
    if window == 'flat': #moving average
        w=numpy.ones(window_len,'d')
    else:
        w=eval('numpy.'+window+'(window_len)')

    y=numpy.convolve(w/w.sum(),s,mode='valid')
    return y

Also please take a look at the scipy documentation:

If you are looking for all entries in the 1d array a smaller than their neighbors, you can try

numpy.r_[True, a[1:] < a[:-1]] & numpy.r_[a[:-1] < a[1:], True]

In SciPy >= 0.11 you can use the following:

import numpy as np
from scipy.signal import argrelextrema

x = np.random.random(12)

# for local minima
argrelextrema(x, np.less)
Grill answered 19/9, 2017 at 12:50 Comment(5)
Thank you for your anwer. I have found this code. Could you tell me what is "s". I have found convole function, but there is it is for two arrays: "Convolve two N-dimensional arrays."Telethon
I have tried convolve function, but I have got error: TypeError: convolve() missing 1 required positional argument: 'in2'. So is it possible to use this function just with one array ?Telethon
Do you use numpy.convolve() function or scipy.signal.convolve()?Grill
I used scipy.signal.convolve(), but as I look at numpy.convolve() there are also two arrays as parameters (a,v) - numpy.convolve(a, v, mode='full')Telethon
I did. I thougth it is not working but I think it is because I have to many values - 1 million values, when I changed number of bins in the plot I could see it is more smooth. Thank you.Telethon

© 2022 - 2024 — McMap. All rights reserved.