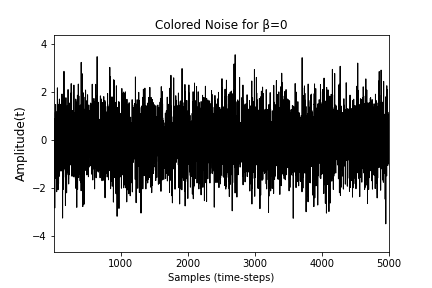
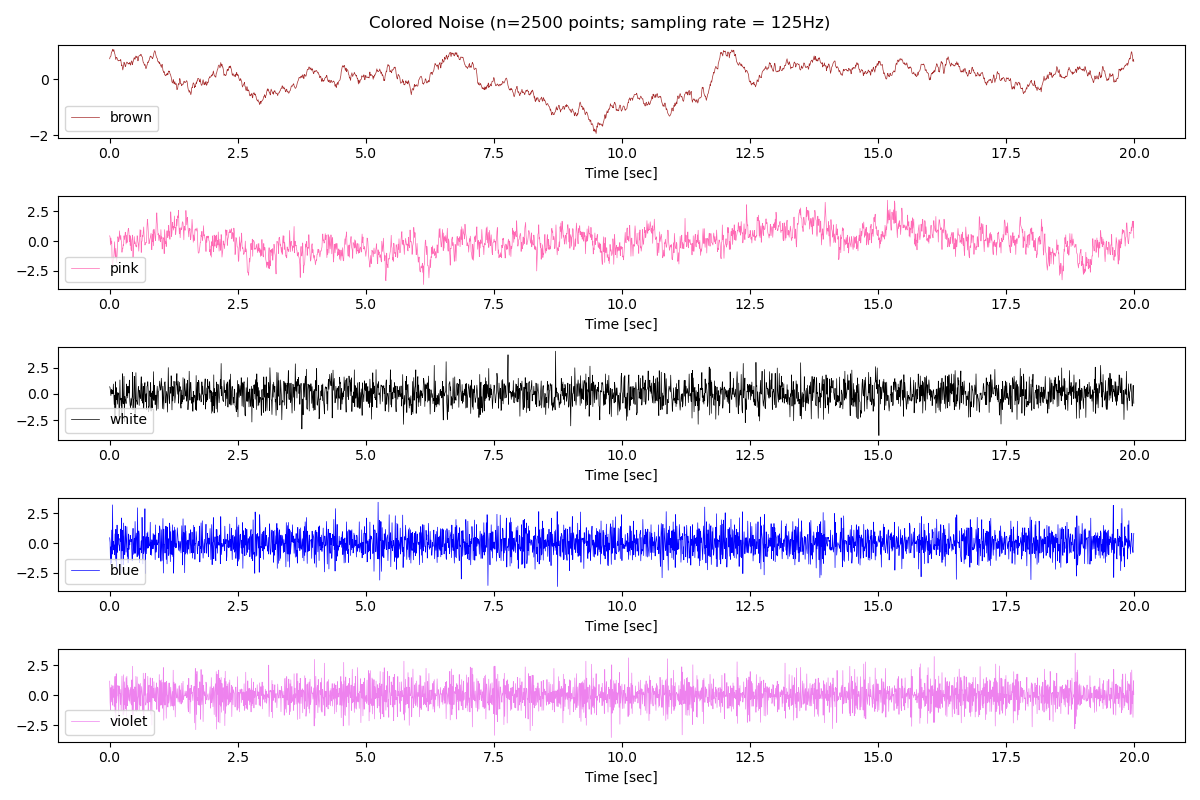
Let's use numpy to compute the noise and matplotlib to plot the results
import numpy as np
import matplotlib.pyplot as plt

def plot_spectrum(s):
    f = np.fft.rfftfreq(len(s))
    return plt.loglog(f, np.abs(np.fft.rfft(s)))[0]
This is a good use case for a python decorator
def noise_psd(N, psd = lambda f: 1):
        X_white = np.fft.rfft(np.random.randn(N));
        S = psd(np.fft.rfftfreq(N))
        # Normalize S
        S = S / np.sqrt(np.mean(S**2))
        X_shaped = X_white * S;
        return np.fft.irfft(X_shaped);

def PSDGenerator(f):
    return lambda N: noise_psd(N, f)

@PSDGenerator
def white_noise(f):
    return 1;

@PSDGenerator
def blue_noise(f):
    return np.sqrt(f);

@PSDGenerator
def violet_noise(f):
    return f;

@PSDGenerator
def brownian_noise(f):
    return 1/np.where(f == 0, float('inf'), f)

@PSDGenerator
def pink_noise(f):
    return 1/np.where(f == 0, float('inf'), np.sqrt(f))
The function PSDGenrator takes as input a function and returns another function that will produce a random signal with the power spectrum shaped accordingly to the given function.
The line S = S / np.sqrt(np.mean(S**2)) makes sure that the colored noise will preserve the energy of the white noise.
Let's test
plt.style.use('dark_background')
plt.figure(figsize=(12, 8), tight_layout=True)
for G, c in zip(
        [brownian_noise, pink_noise, white_noise, blue_noise, violet_noise],
        ['brown', 'hotpink', 'white', 'blue', 'violet']):
    plot_spectrum(G(30*50_000)).set(color=c, linewidth=3)
plt.legend(['brownian', 'pink', 'white', 'blue', 'violet'])
plt.suptitle("Colored Noise");
plt.ylim([1e-3, None]);
![consistently_colored_noise]()


