How to perform a chi-squared goodness of fit test using scientific libraries in Python?
Asked Answered
M

3

19

Let's assume I have some data I obtained empirically:

from scipy import stats
size = 10000
x = 10 * stats.expon.rvs(size=size) + 0.2 * np.random.uniform(size=size)

It is exponentially distributed (with some noise) and I want to verify this using a chi-squared goodness of fit (GoF) test. What is the simplest way of doing this using the standard scientific libraries in Python (e.g. scipy or statsmodels) with the least amount of manual steps and assumptions?

I can fit a model with:

param = stats.expon.fit(x)
plt.hist(x, normed=True, color='white', hatch='/')
plt.plot(grid, distr.pdf(np.linspace(0, 100, 10000), *param))

distribution and empirical data plot

It is very elegant to calculate the Kolmogorov-Smirnov test.

>>> stats.kstest(x, lambda x : stats.expon.cdf(x, *param))
(0.0061000000000000004, 0.85077099515985011)

However, I can't find a good way of calculating the chi-squared test.

There is a chi-squared GoF function in statsmodel, but it assumes a discrete distribution (and the exponential distribution is continuous).

The official scipy.stats tutorial only covers a case for a custom distribution and probabilities are built by fiddling with many expressions (npoints, npointsh, nbound, normbound), so it's not quite clear to me how to do it for other distributions. The chisquare examples assume the expected values and DoF are already obtained.

Also, I am not looking for a way to "manually" perform the test as was already discussed here, but would like to know how to apply one of the available library functions.

Mabe answered 23/6, 2014 at 16:40 Comment(5)
As far as I know, there is no "official" python library function for the chisquare test that includes binning for continuous distribution. I would recommend using Anderson-Darling, scipy's anderson, which should have better power, if I remember correctly.Shaer
OK, but from what I can see the anderson implementation in SciPy only supports 5 distributions.Mabe
Yes, but anderson supports exponential distribution which you are using. If you estimate the parameters of the distribution and you want it to work for any distribution, then you are back to binning for the chisquare, or bootstrapping another one of the gof tests.Shaer
Can you please explain in an answer how would I perform the binning and the chi-squared test on my example? I know I need to use hstack and combine bins to have >5 data points, but I don't know how to get the array of probabilities for these bins. I am trying to find a general workflow that I can use on arbitrary data and I would rather not be limited to only a few distributions as with the anderson implementation.Mabe
Your way of using the Kolmogorov-Smirnov test is statistically wrong, because the distribution's parameters are estimated from the sample. The correct way to do this is to use Lilliefors' test: en.wikipedia.org/wiki/Lilliefors_testWhipsaw
S
5

An approximate solution for equal probability bins:

  • Estimate the parameters of the distribution
  • Use the inverse cdf, ppf if it's a scipy.stats.distribution, to get the binedges for a regular probability grid, e.g. distribution.ppf(np.linspace(0, 1, n_bins + 1), *args)
  • Then, use np.histogram to count the number of observations in each bin

then use chisquare test on the frequencies.

An alternative would be to find the bin edges from the percentiles of the sorted data, and use the cdf to find the actual probabilities.

This is only approximate, since the theory for the chisquare test assumes that the parameters are estimated by maximum likelihood on the binned data. And I'm not sure whether the selection of binedges based on the data affects the asymptotic distribution.

I haven't looked into this into a long time. If an approximate solution is not good enough, then I would recommend that you ask the question on stats.stackexchange.

Shaer answered 24/6, 2014 at 14:5 Comment(3)
Re: whether binning will affect the asymptotoic distribution, it pretty much has to. It may be negligible, though. For binning & using the chi-squared test, this is going to be the right answer. +1Heidyheifer
@Gung It depends on the nature of the aysymptotics. I believe that if you fit cutpoints in a way that allows the minimum expected bin count to grow large, the asymptotic distribution ought to be chi-squared. But the asymptotic distribution is irrelevant: what matters is the actual distribution, and it is clear that establishing the cutpoints based on the data will introduce arbitrary changes in that distribution (if only a little bit).Scholastic
@user333700 Could you please provide an example of the solution you have provided. I have tried this: In: np.random.seed(453), In: data_1 = stats.norm.rvs(size=10000), In: loc, scale = stats.norm.fit(data_1), In: data_2 = stats.norm(loc, scale).rvs(size=10000), In: data_1_hist = np.histogram(data_1, bins=10), In: data_2_hist = np.histogram(data_2, bins=10), In: print stats.chisquare(data_2_hist[0], data_1_hist[0]), Out: (statistic=564.43784612331842, pvalue=8.926608295951506e-116). Also, how distribution.ppf(np.linspace(0, 1, n_bins + 1), *args) should be used?Tibbitts
H
2

Why do you need to "verify" that it's exponential? Are you sure you need a statistical test? I can pretty much guarantee that is isn't ultimately exponential & the test would be significant if you had enough data, making the logic of using the test rather forced. It may help you to read this CV thread: Is normality testing 'essentially useless'?, or my answer here: Testing for heteroscedasticity with many observations.

It is typically better to use a qq-plot and/or pp-plot (depending on whether you are concerned about the fit in the tails or middle of the distribution, see my answer here: PP-plots vs. QQ-plots). Information on how to make qq-plots in Python SciPy can be found in this SO thread: Quantile-Quantile plot using SciPy

Heidyheifer answered 24/6, 2014 at 14:25 Comment(8)
I didn't know about QQ-plotting. I'll look into it, thanks. My motivation is simply to be able to give some quantitative measure of how certain can one be of the dataset's distribution (something more formal than "looking at the histogram, it seems exponential"). I thought that goodness of fit tests can help me here, but I see now from the discussion you linked that it might not be that simple :)Mabe
There are ways to quantify how close two distributions are. A statistical test doesn't quite give you that, b/c the p-value is a function of both that distance & your N. You can use the correlation of the points in a qq- or pp-plot (but bear in mind that r will always be close to 1), you could also use something like KL (not actually a distance). You could also ask a question on CV about the best way to get a quantitative measure of the distance b/t 2 dists. It will turn out to be complicated & depend on what you need.Heidyheifer
chisquare gives you a measure of distance, you can also pick any of the other gof test as a "distance measure". However, it won't tell you much in magnitude. The problems are not specific to gof tests. In all hypothesis tests, you have to worry about too little power in small sample sizes and too much power in large sample sizes. statsmodels has functions to calculate the effect size and power of a chisquare test, e.g. statsmodels.sourceforge.net/devel/generated/…Shaer
If you first hypothesized the distribution is exponential after looking at the histogram, then the p-values for any goodness of fit test will be overoptimistically high. In any case they won't ever tell you how certain you can be that the underlying population or process is exponential, but if you get a very low p-value at least you have a basis for acting as if the exponential hypothesis is incorrect.Scholastic
Thanks for all the input. As always, I see that I have much more learning to do. It would be nice if there was a book explaining how to use some of these scipy/statsmodels functions on real data analysis examples. The current documentation is just too scarce for me to understand all the functions. I'll post any additional, statistics-related questions to CV.Mabe
You're welcome, @kermit666. I don't know of a Python-based such book (there are many for R). You could ask on CV for book recommendations that focus on Python.Heidyheifer
@metakermit, have you found a book with real data examples in python / pandas since then ?Klingensmith
@Klingensmith nope :) I mean, you can find lots of Pandas materials in McKinney's book "Python for Data Analysis", but it's mostly basic stuff – it doesn't go too deep into statistics. I'm afraid the best way is to just read good statistics textbooks and bridge the gap to Python yourself or try some books from the R community (I think there are more statisticians among them).Mabe
L
1

I tried you problem with OpenTURNS. Beginning is the same:

import numpy as np
from scipy import stats
size = 10000
x = 10 * stats.expon.rvs(size=size) + 0.2 * np.random.uniform(size=size)

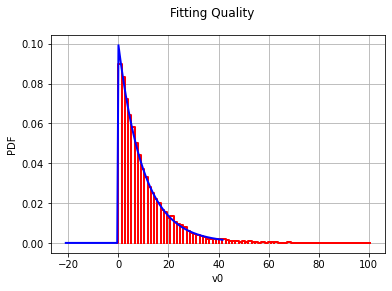
If you suspect that your sample x is coming from an Exponential distribution, you can use ot.ExponentialFactory() to fit the parameters:

import openturns as ot
sample = ot.Sample([[p] for p in x])
distribution = ot.ExponentialFactory().build(sample)

As Factory needs a an ot.Sample() as input, I needed format x and reshape it as 10.000 points of dimension 1.

Let's now assess this fitting using ChiSquared test:

result = ot.FittingTest.ChiSquared(sample, distribution, 0.01)
print('Exponential?', result.getBinaryQualityMeasure(), ', P-value=', result.getPValue())
>>> Exponential? True , P-value= 0.9275212544642293

Very good!

And of course, print(distribution) will give you the fitted parameters:

>>> Exponential(lambda = 0.0982391, gamma = 0.0274607)

enter image description here

Laud answered 5/11, 2020 at 14:54 Comment(0)

© 2022 - 2024 — McMap. All rights reserved.