In Chrome DevTools, how can you tell which responses were sent using HTTP/2 server push?
Asked Answered
G

1

19

HTTP/2 server push allows a server to "push" resources to the browser before the browser has actually requested them.

When using the network tab of the Chrome DevTools, how can I tell which resources were "pushed" vs. ones that were requested in the traditional way?

I know that I can enable the Protocol column in the network tab, and that shows some calls as "h2" which I assume means HTTP/2. But what do I look for to tell whether it was actually pushed?

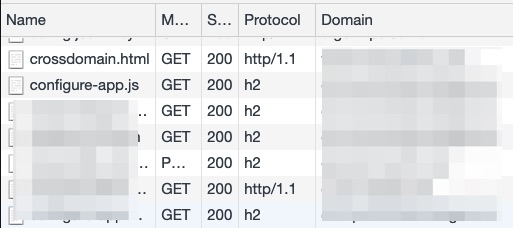
enter image description here

Gorge answered 22/2, 2019 at 18:1 Comment(0)
E
20

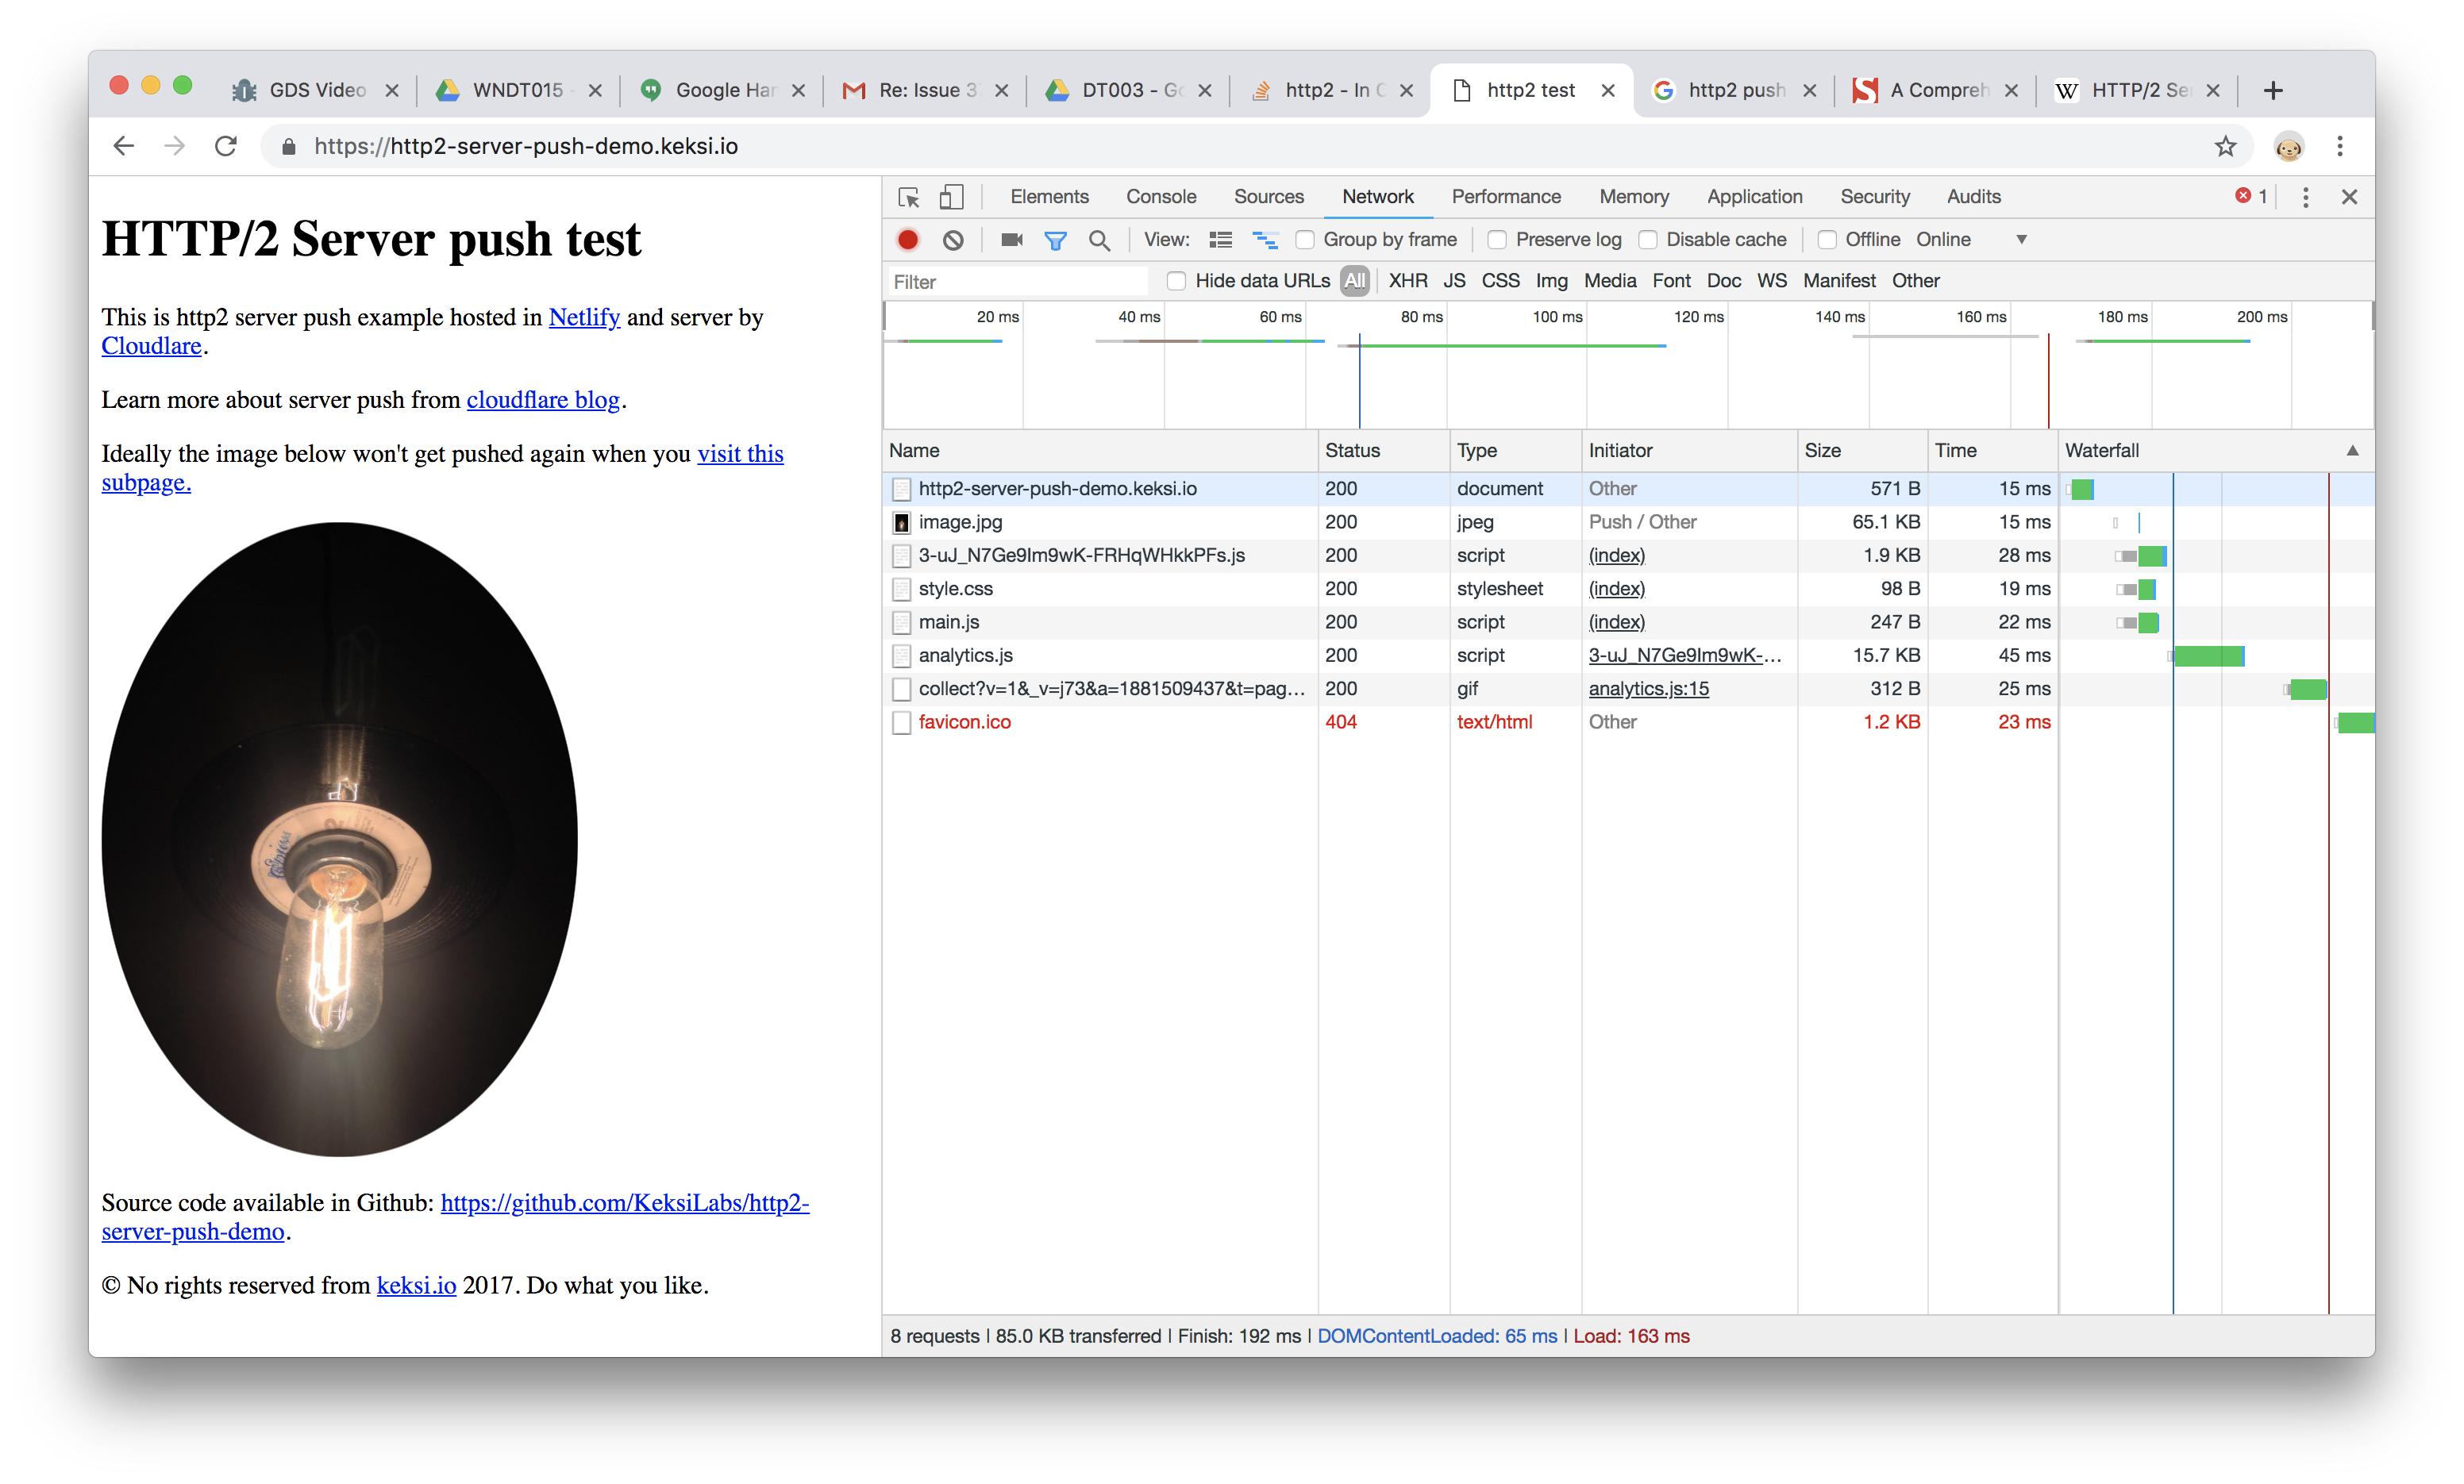
Look for Push in the Initiator column. See image.jpg in the screenshot below.

Network Log

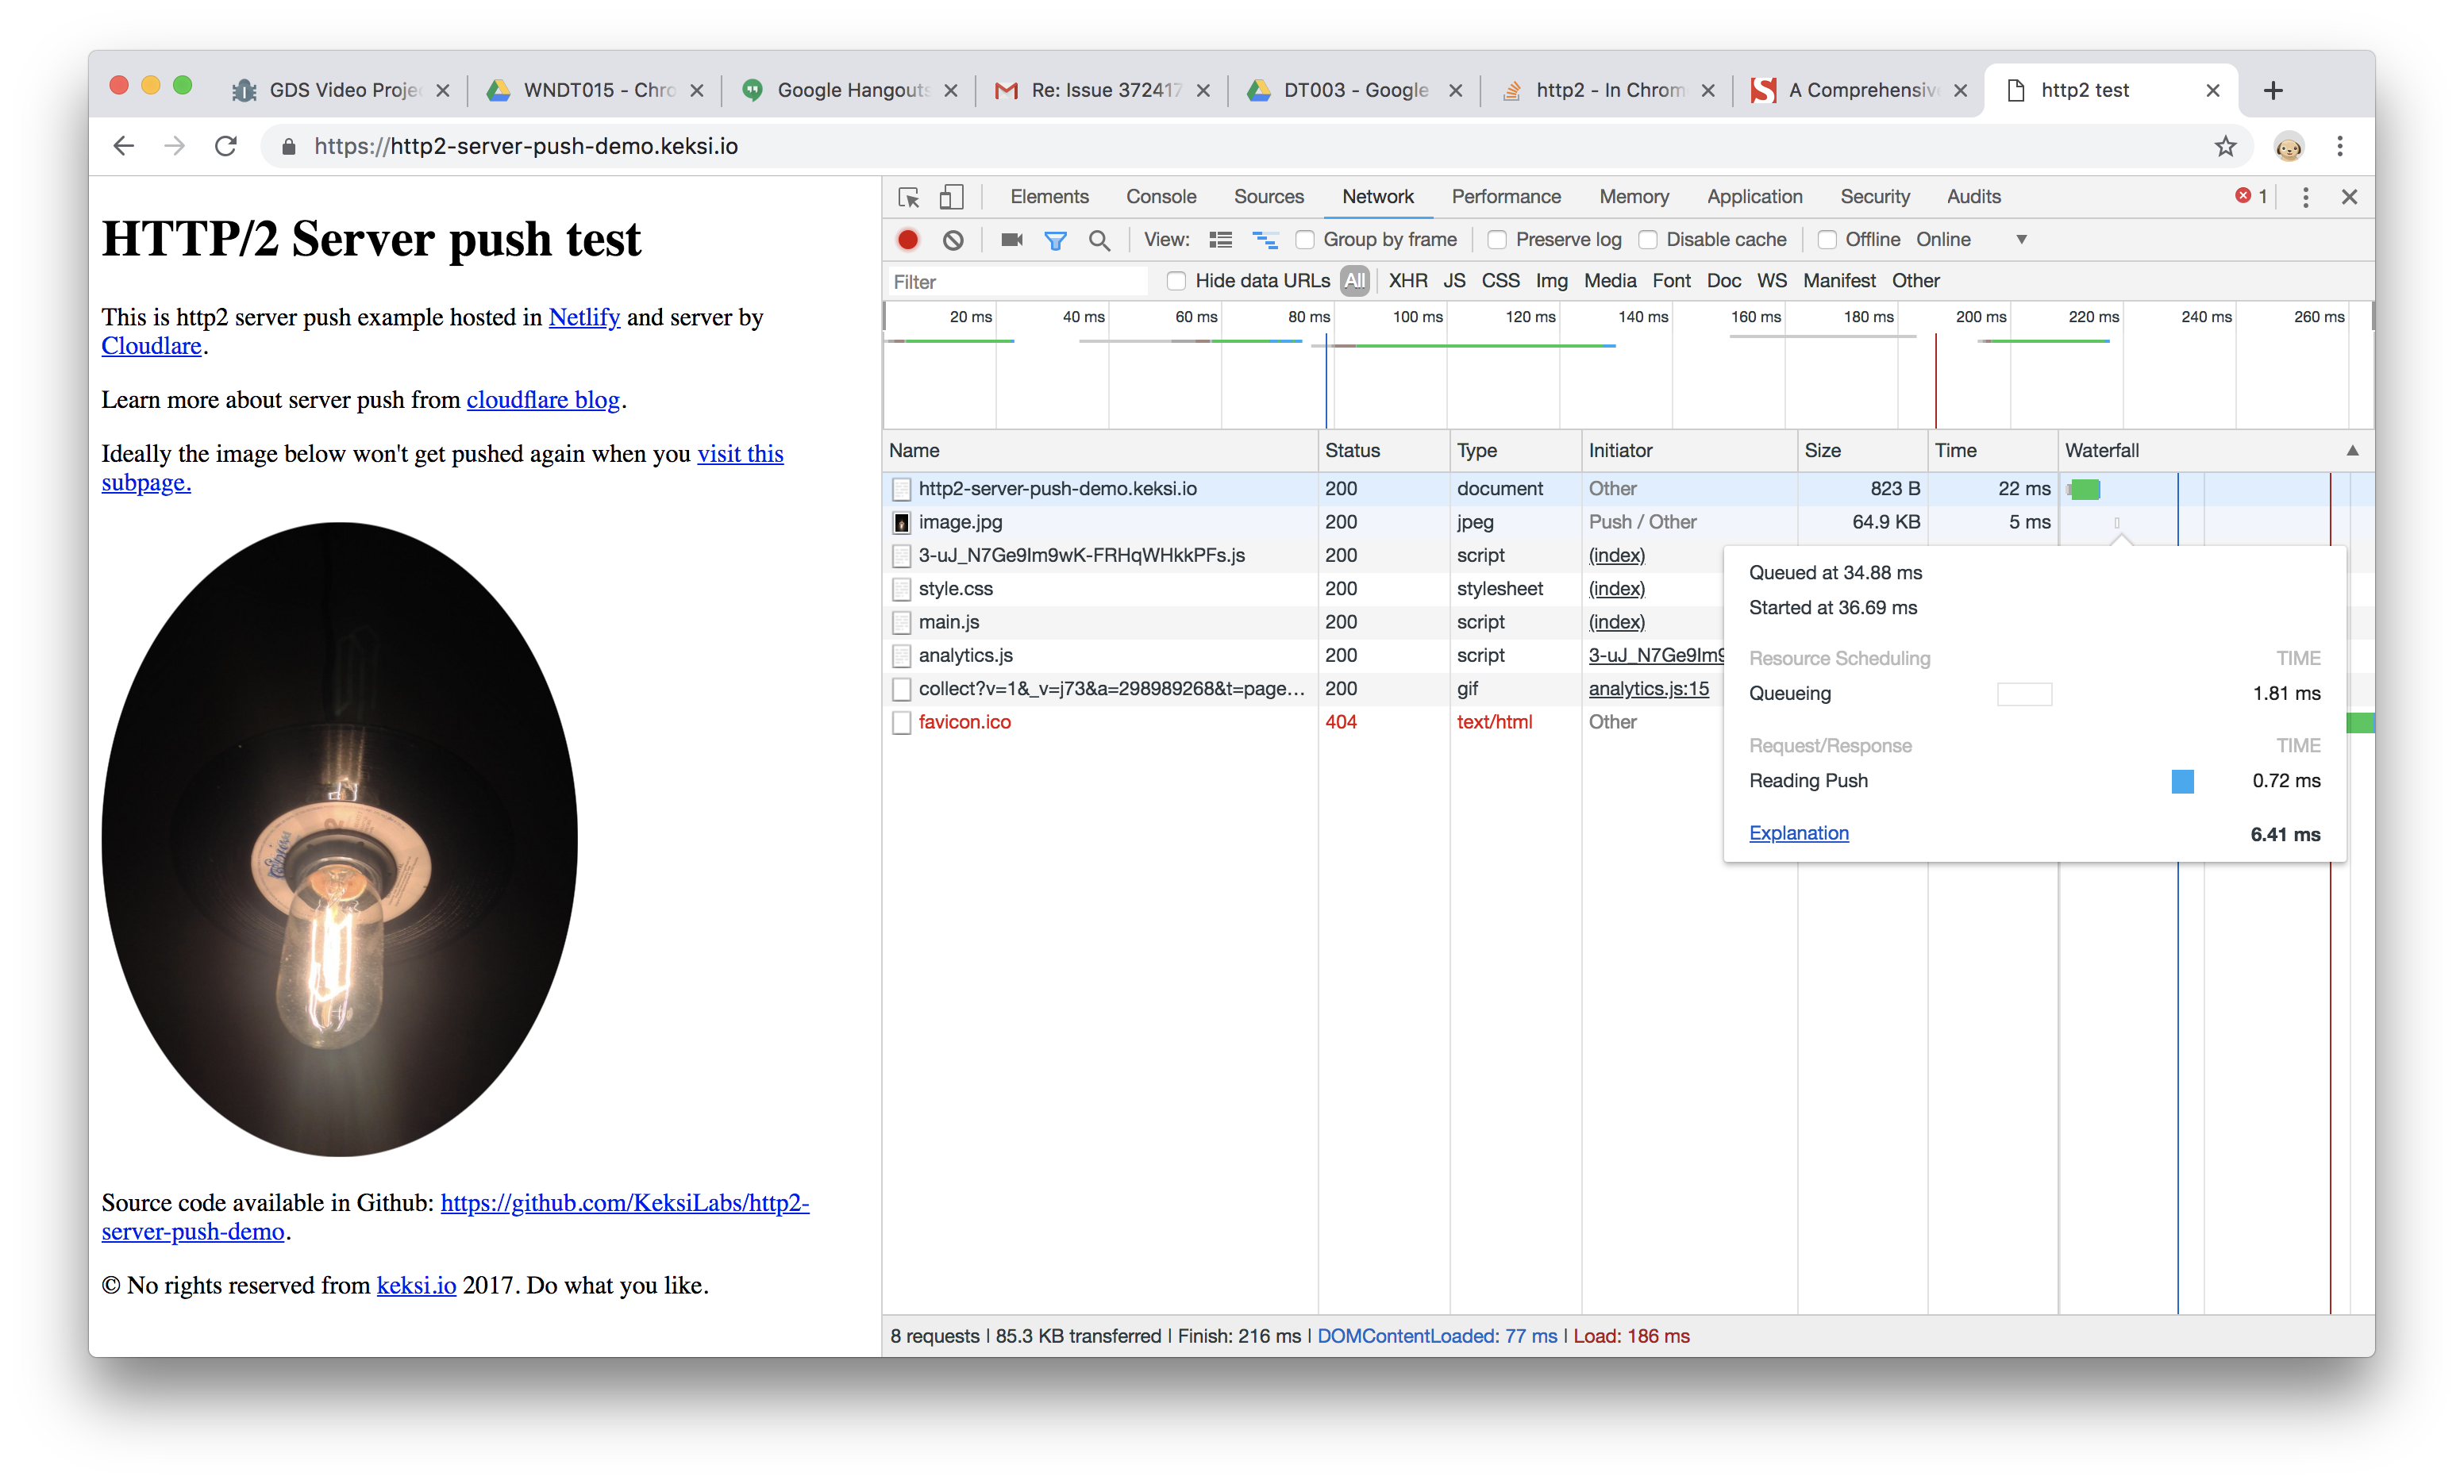
Hovering over the Waterfall also shows a breakdown of the push-related activity.

Waterfall

I know that I can enable the Protocol column in the network tab, and that shows some calls as "h2" which I assume means HTTP/2.

Yes, this is correct. h2 stands for HTTP/2. As mentioned, the Protocol column is hidden by default. Right-click the table header and select Protocol to enable it. See Show more information for an example.

Exciseman answered 22/2, 2019 at 20:2 Comment(1)
Thank you! That's exactly what I was looking for. Unfortunately, the traffic I thought was getting pushed was not in fact pushed. I'm trying to troubleshoot why HTTP/2 requests are not being successfully redirected by my Chrome extension, which uses chrome.webRequest.onBeforeRequest.addListener to redirect calls.Gorge

© 2022 - 2024 — McMap. All rights reserved.