Weighted linear regression with Scikit-learn
Asked Answered
H

2

19

My data:

State           N           Var1            Var2
Alabama         23          54              42
Alaska          4           53              53
Arizona         53          75              65

Var1 and Var2 are aggregated percentage values at the state level. N is the number of participants in each state. I would like to run a linear regression between Var1 and Var2 with the consideration of N as weight with sklearn in Python 2.7.

The general line is:

fit(X, y[, sample_weight])

Say the data is loaded into df using Pandas and the N becomes df["N"], do I simply fit the data into the following line or do I need to process the N somehow before using it as sample_weight in the command?

fit(df["Var1"], df["Var2"], sample_weight=df["N"])
Hafner answered 6/2, 2016 at 2:58 Comment(4)
That depends on how you'd like to weigh things, but basically, yes, you can use the values as is: data from Arizona will be weighted a lot more than from Alaska that way. (If N were a standard deviation, you'd probably wanted to use 1/N**2 as weights, for example).Pasto
You may want to make sure your data are all floating point values, not integers. Perhaps fit will make sure of that, but the documentation doesn't mention that, so you'd have to look at the code in scikit-learn to know that. Better cast to float yourself.Pasto
I see, thanks for the confirmation. I do wonder how did you know that? I tried to refer to the documentation of scikit-learn online, they didn't specify it (or maybe I am missing something).Hafner
Know what? Weights in linear regressions/chi-square fitting are generally used in the same manner. See things like numpy's polyfit or scipy's curve_fit. sci-kit learn probably hands out the actual fitting to polyfit or the like.Pasto
B
21

The weights enable training a model that is more accurate for certain values of the input (e.g., where the cost of error is higher). Internally, weights w are multiplied by the residuals in the loss function [1]:

enter image description here

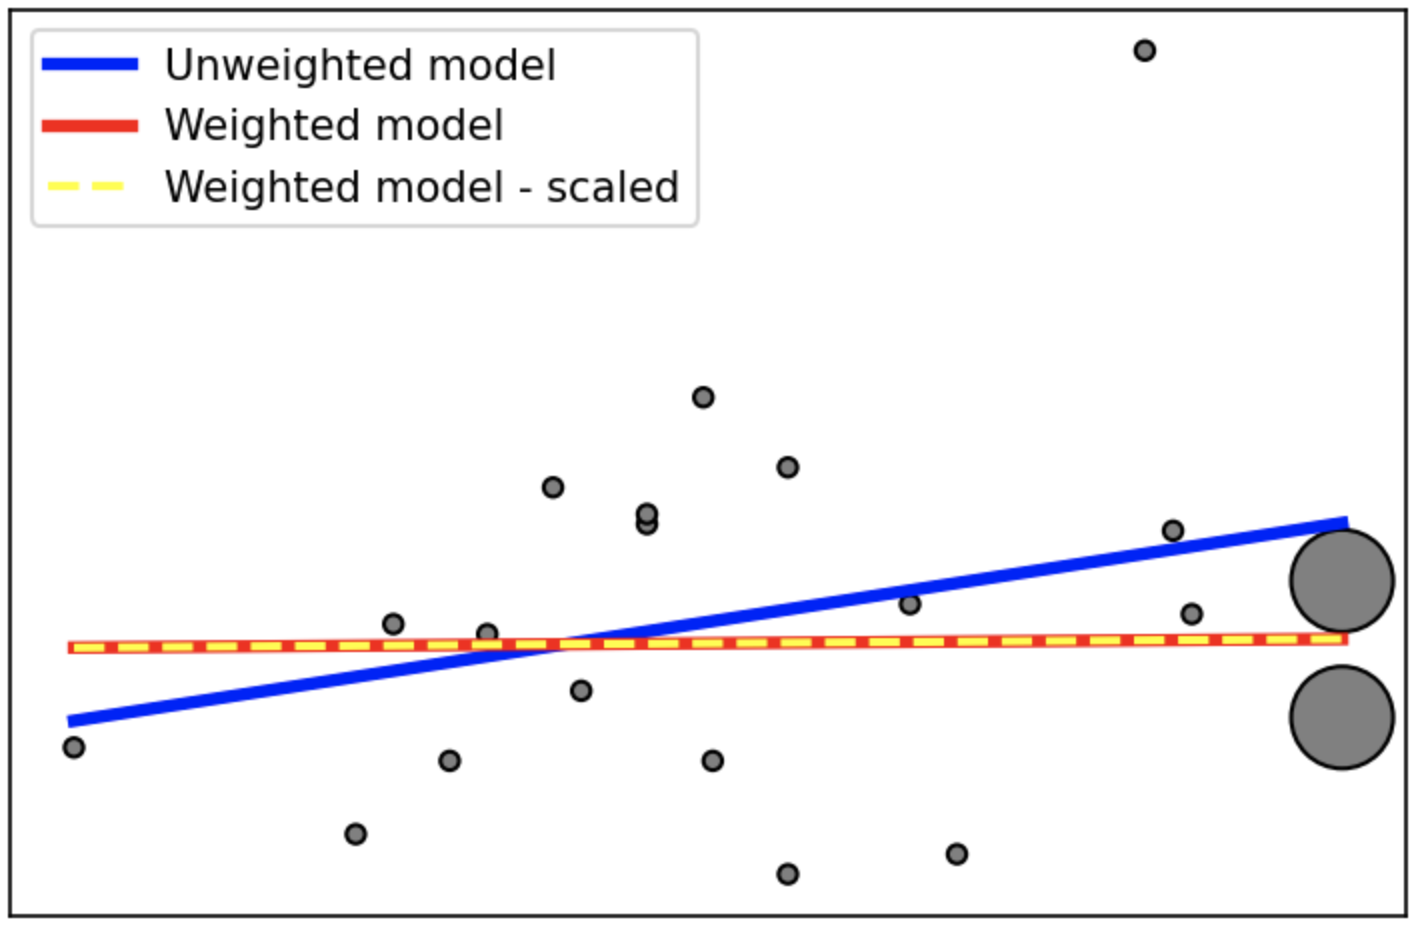
Therefore, it is the relative scale of the weights that matters. N can be passed as is if it already reflects the priorities. Uniform scaling would not change the outcome.

Here is an example. In the weighted version, we emphasize the region around last two samples, and the model becomes more accurate there. And, scaling does not affect the outcome, as expected.

import matplotlib.pyplot as plt
import numpy as np
from sklearn import datasets
from sklearn.linear_model import LinearRegression

# Load the diabetes dataset
X, y = datasets.load_diabetes(return_X_y=True)
n_samples = 20

# Use only one feature and sort
X = X[:, np.newaxis, 2][:n_samples]
y = y[:n_samples]
p = X.argsort(axis=0)
X = X[p].reshape((n_samples, 1))
y = y[p]

# Create equal weights and then augment the last 2 ones
sample_weight = np.ones(n_samples) * 20
sample_weight[-2:] *= 30

plt.scatter(X, y, s=sample_weight, c='grey', edgecolor='black')

# The unweighted model
regr = LinearRegression()
regr.fit(X, y)
plt.plot(X, regr.predict(X), color='blue', linewidth=3, label='Unweighted model')

# The weighted model
regr = LinearRegression()
regr.fit(X, y, sample_weight)
plt.plot(X, regr.predict(X), color='red', linewidth=3, label='Weighted model')

# The weighted model - scaled weights
regr = LinearRegression()
sample_weight = sample_weight / sample_weight.max()
regr.fit(X, y, sample_weight)
plt.plot(X, regr.predict(X), color='yellow', linewidth=2, label='Weighted model - scaled', linestyle='dashed')
plt.xticks(());plt.yticks(());plt.legend();

enter image description here

(this transformation also seems necessary for passing Var1 and Var2 to fit)

Bunn answered 30/4, 2020 at 21:52 Comment(0)
H
0

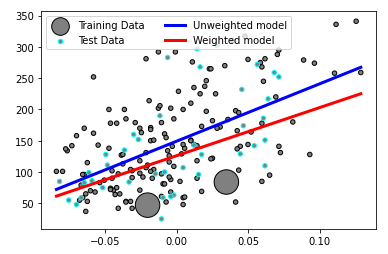
The answer by @Reveille is great. Below, I add just a bit to their answer, showing how to include weighted samples as part of the sklearn pipeline.

import matplotlib.pyplot as plt
import numpy as np
from sklearn import datasets
from sklearn.linear_model import LinearRegression
from sklearn.model_selection import train_test_split
from sklearn.preprocessing import PolynomialFeatures
from sklearn.pipeline import Pipeline

# Load the diabetes dataset
X, y = datasets.load_diabetes(return_X_y=True)
n_samples = 200

# Use only one feature and sort
X = X[:, np.newaxis, 2][:n_samples]
y = y[:n_samples]
p = X.argsort(axis=0)
X = X[p].reshape((n_samples, 1))
y = y[p]

# example of a process added to pipeline
# create split
test_split_percent=0.2
X_train, X_test, y_train, y_test = train_test_split(X, y, test_size=test_split_percent, random_state=12)

# Create equal weights and then augment the last 2 ones
sample_weight = np.ones(X_train.shape[0]) * 20
sample_weight[-2:] *= 30

# plot split data
plt.scatter(X_train, y_train, s=sample_weight, c='grey', edgecolor='black', label='Training Data')
plt.scatter(X_test, y_test, s=np.ones(X_test.shape[0]) * 20, c='grey', edgecolor='cyan', label='Test Data')

# The unweighted model
regr = LinearRegression()
regr.fit(X_train, y_train)
plt.plot(X, regr.predict(X), color='blue', linewidth=3, label='Unweighted model')

# The weighted model
degree = 1

# setup of the pipeline
reg_pipeline = Pipeline([('poly', PolynomialFeatures(degree=degree)), 
                         ('mylinearreg', LinearRegression(fit_intercept=True))])

# use the named_steps prepend to set the keyword: {name}__sample_weight
print(f"Here are your named steps: {reg_pipeline.named_steps.keys()}")
reg = reg_pipeline.fit(X_train, y_train, mylinearreg__sample_weight=sample_weight.reshape(1, -1)[0])

# plot weighted result
plt.plot(X, reg.predict(X), color='red', linewidth=3, label='Weighted model')
plt.legend(ncol=2)

enter image description here

Hoffmann answered 6/2 at 1:42 Comment(0)

© 2022 - 2024 — McMap. All rights reserved.