Freeze screen in chrome debugger / DevTools panel for popover inspection?
Asked Answered
S

13

602

I'm using the chrome inspector to try and analyze the z-index of a twitter bootstrap popover, and finding it extremely frustrating...

Is there a way to freeze the popover (while shown) so that I can assess and modify the associated CSS?

Placing a fixed 'hover' on the associated link does not cause the popover to appear.

Sheffie answered 29/7, 2013 at 18:32 Comment(5)
Try setting a breakpoint in your JavaScript immediately after the popup is shown (debugger;)Decorous
I use window.setTimeout to trigger debugger in 5 seconds, then hover over element and wait.Outclass
Hello, DevTools technical writer here. Can you all send me MVCEs demonstrating the problem? As of 2019 we have a few tools that should do the trick (event listener breakpoints, pseudo-class toggles) but I can't provide a detailed answer until I can reproduce your situation.Hairbreadth
You can found other solution here for Chrome & FirefoxMasochism
@KayceBasques Here's an example: telerik.com/kendo-angular-ui/components/dropdowns/dropdownlist Click on the dropdown list to open it, then try inspecting the list content popover in the Elements view.Californium
S
951

Got it working. Here was my procedure:

  1. Browse to the desired page
  2. Open the dev console - F12 on Windows/Linux or option + + J on macOS
  3. Select the Sources tab in chrome inspector
  4. In the web browser window, hover over the desired element to initiate the popover
  5. Hit F8 on Windows/Linux (or fn + F8 on macOS) while the popover is showing. If you have clicked anywhere on the actual page F8 will do nothing. Your last click needs to be somewhere in the inspector, like the sources tab
  6. Go to the Elements tab in inspector
  7. Find your popover (it will be nested in the trigger element's HTML)
  8. Have fun modifying the CSS
Sheffie answered 29/7, 2013 at 19:8 Comment(17)
This workflow gave me a short, useful introduction to the breakpoint debugger and helped isolate a menu that was difficult to style, as it disappeared on Console click.Bondswoman
I needed this while my mouse was pressed. Didn't work because I had to press my mouse which de-focused the console. So I added a breakpoint on mouseout which worked, although I had to resume (also F8) a few times until it triggered on the correct element. A bit wonky, but useful!Pisciculture
I would assume this would work on a mac as long as you're using chrome... Perhaps you're getting hung up on the keyboard shortcuts? developer.chrome.com/devtools/docs/shortcutsSheffie
If the DOM element uses the focusout event to hide you have no chance to hit F8!Climactic
@Dean to trigger F8 you need to use fn!Manoff
For more info, what F8 shortcut does is actually pause the debugger(script execution). And ctrl + \ also works. (cmd + \ in MacOS).Kappel
Or you can press F8 twicePhilomenaphiloo
It's great fun refreshing the page and trying to fn+f8 at just the right moment. They should release it as a game on Steam.Tilford
Good to know: It's not working when you open the dev console in a new window.Worry
I'm on Chrome 74 on Mojave and the opposite of this is actually true (you have to click on the page first before F8): "If you have clicked anywhere on the actual page F8 will do nothing. Your last click needs to be somewhere in the inspector, like the sources tab"Population
I just retested on Chrome Version 76.0.3809.100 (Official Build) (64-bit)... also on Mojave, and it still seems to work as described.Sheffie
The freakin best answer I've seen since before this summer. Thank you SO much @SheffieLafrance
Did not work for me when trying to inspect an autocomplete React component. The setTimeout() approach mentioned below worked, however. I have no idea why, to be honest.Chromium
@Chromium I also had trouble with a React Select component which showed an artifact only with clearable={false} searchable={false}. However, it disappears on F8, on setTimeout and even if I use the setTimeout approach but with throwing and catching an error instead of debugger.Demagogy
it didn't work, as soon as you press f8 and start the debugger autocomplete popup dsappearsAddiel
As for the time being, this answer helped me https://mcmap.net/q/64218/-freeze-screen-in-chrome-debugger-devtools-panel-for-popover-inspection instead of the current answer. Maybe it's outdated.Grosbeak
i dont know whether it is obvious to everyone (well, it was not for me), but on macOS I also had to press the fn button together with the F8. Could be a configuration matter though, but only a media player toggled between its play/pause state without pressing the fn.. TLDR: fn + F8Russophobe
S
541

To be able to inspect any element do the following. This should work even if it's hard to duplicate the hover state:

  • Run the following javascript in the console. This will break into the debugger in 5 seconds.

    setTimeout(function(){debugger;}, 5000)

  • Go show your element (by hovering or however) and wait until Chrome breaks into the Debugger.

  • Now click on the Elements tab in the Chrome Inspector, and you can look for your element there.
  • You may also be able to click on the Find Element icon (looks like a magnifying glass) and Chrome will let you go and inspect and find your element on the page by right clicking on it, then choosing Inspect Element

Note that this approach is a slight variation to this other great answer on this page.

Subaudition answered 11/2, 2015 at 12:34 Comment(9)
i respect that you paid proper respect to frzsombor's answer. nice.Satori
This is what I needed, as the functionality was due to a DOM element getting added on js Focus, and removed on blur, which always happens when you switch to the dev tools.Eschew
Abram's F8 solution did not work for me. This one did. Thanks!Seek
Thx. I made a bookmark with title: ❚❚, address: javascript:debugger;. F8 works, but for those who prefer to use mouse this might be more convenient.Damondamour
As others have commented the F8 answer was not working for me, and was driving me completely nuts! This works like a charm. Thank you!Ceremonious
Very neat trick! I will use this one from now on instead of Sources -> F8.Babel
This is useful if you need to click on the page to access whatever you are trying to debug, since f8 doesn't work when focus is on the pageMeliamelic
timeout + debug genious!Comatose
This is preferable solution generally. F8 might work for hovering over elements, but this also works for flyouts appearing after clicking (that disappear from source when losing focus) and much more.Goggle
E
137

UPDATE: As Brad Parks wrote in his comment there is a much better and easier solution with only one line of JS code:

run setTimeout(function(){debugger;},5000);, then go show your element and wait until it breaks into the Debugger


Original answer:

I just had the same problem, and I think I found an "universal" solution. (assuming the site uses jQuery)

  1. Go to elements tab in inspector
  2. Right click <body> and click "Edit as HTML"
  3. Add the following element after <body> then press Ctrl+Enter:
    <div id="debugFreeze" data-rand="0"></div>
  4. Right click this new element, and select "Break on..." -> "Attributes modifications"
  5. Now go to Console view and run the following command:
    setTimeout(function(){$("#debugFreeze").attr("data-rand",Math.random())},5000);
  6. Now go back to the browser window and you have 5 seconds to find your element and click/hover/focus/etc it, before the breakpoint will be hit and the browser will "freeze".
  7. Now you can inspect your clicked/hovered/focused/etc element in peace.

Of course you can modify the javascript and the timing, if you get the idea.

Entrust answered 16/4, 2014 at 0:12 Comment(4)
Hey! Great idea... you don't even need to add the extra div though... Just run this javascript instead setTimeout(function(){debugger;}, 5000);, then go show your element and wait until it breaks into the Debugger. Then click on the "Elements" tab in the Chrome Inspector, and you can look for your element there. You may also abe able to click on the "Find Element" icon (looks like a magnifying glass) and Chrome will let you go and inspect and find your element on the page by right clicking on it, then choosing "Inspect Element".Subaudition
I don't have f8 on my keyboard, this answer saved me, thanksHoxie
Thanks this helped me, I added the following and did the trick: onclick="setTimeout(function(){debugger;},5000);"Uneventful
this is one of the most genius ideas everPierrette
B
63
  1. Right click anywhere inside Elements Tab
  2. Choose Breakon... > subtree modifications
  3. Trigger the popup you want to see and it will freeze if it see changes in the DOM
  4. If you still don't see the popup, click Step over the next function(F10) button beside Resume(F8) in the upper top center of the chrome until you freeze the popup you want to see.
Bowden answered 10/2, 2015 at 17:14 Comment(0)
S
23

I found that this works really well in Chrome.

Right click on the element that you'd like to inspect, then click Force Element State > Hover. Screenshot attached.

Force element state

Streptokinase answered 31/5, 2015 at 20:41 Comment(1)
It will work only if the popover is triggered by css.Manoff
N
5

I tried the other solutions here, they work but I'm lazy so this is my solution

  1. hover over the element to trigger expanded state
  2. ctrl+shift+c
  3. hover over element again
  4. right click
  5. navigate to the debugger

by right clicking it no longer registers mouse event since a context menu pops up, so you can move the mouse away safely

Ningpo answered 22/6, 2018 at 19:46 Comment(1)
Shame. That doesn't work, nor F8 eitherStrop
I
5

I recently ran into this issue and pressing F8 solution didn't work for me. Here's how I froze the hover element.

  1. Right click the tag with the hover in Chrome and select it in Elements tab.
  2. On the right side window, select Event Listeners
  3. Expand the mouseout event
  4. click the remove button shown there.
  5. Now if you hover over your element, it will trigger mouseover event but cannot trigger mouseout when your curser leave the element, since we deleted that.

Hope this helps.enter image description here

Impermissible answered 22/8, 2022 at 21:27 Comment(0)
M
3

You can use Bookmarklets to run a script to enter debugging mode (and thus freeze the viewport including all active states. It's the easiest method to inspect elements hidden behind a state if you ask me.

  1. Add a bookmark to your browser.
  2. Name it Freeze for example
  3. In the URL field, enter javascript: setTimeout(()=>{debugger}, 2000)
  4. Open Dev Tools (⌘ + Shift + C is my go to or F12)
  5. Click the Freeze bookmark
  6. Trigger the hover/active state in the view port as you normally would before 2s elapse
  7. Your view port is now frozen in the current state and you can inspect your previously hidden elements

Obviously you can change the interval until the debugger activates. Hope this helps!

Madonnamadora answered 20/4, 2023 at 16:46 Comment(0)
V
2

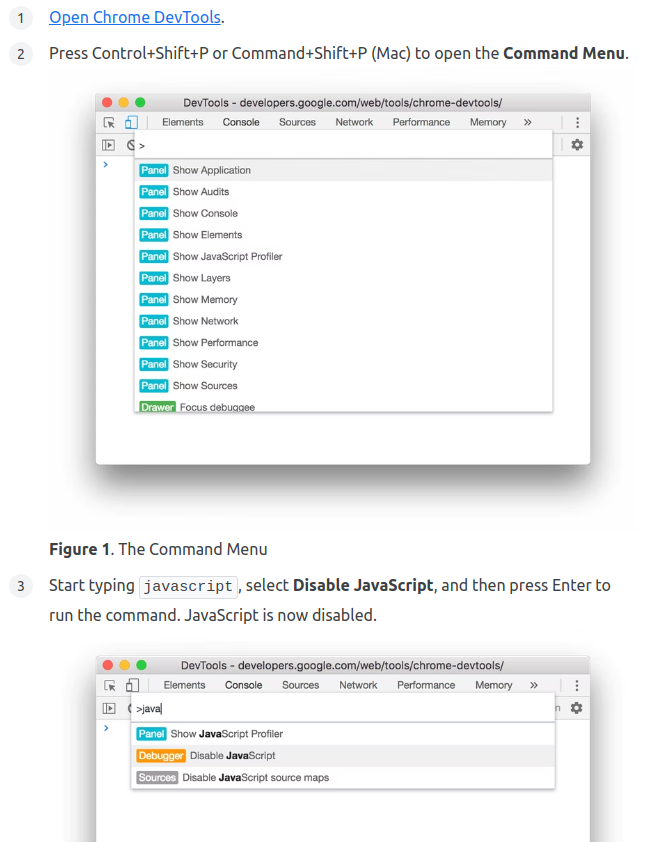
None of the solutions worked for me, only the one as described on : https://developer.chrome.com/docs/devtools/javascript/disable/

for Linux ( for Mac use command instead of comtrol ):

  • Open developer tools ( ctrl + shift + I )
  • Run command window ( ctrl + shift + P )
  • Start typing javascript and select disable javascript

screenshot of instructions:

enter image description here

Vidar answered 16/6, 2022 at 8:44 Comment(0)
F
2

I have written a chrome extension that help you freeze the DOM instantly for debugging and validating purpose https://chrome.google.com/webstore/detail/freeze-dom/onekmnelbichmlnmkecckkjjljifhefg

How to use it:

  • Open DevTools Panel
  • Right Click -> select 'Freeze DOM' or Press Cmd + Shift + S (on Mac) / Cmd + Shift + S (on Window, Ubuntu)
Fiacre answered 2/9, 2023 at 12:49 Comment(0)
C
1

Fn+F12-->3 dots in inspector right side-->more tools -->Rendering--> select Emulate a focused page

Cichocki answered 22/2 at 9:0 Comment(2)
Your answer could be improved with additional supporting information. Please edit to add further details, such as citations or documentation, so that others can confirm that your answer is correct. You can find more information on how to write good answers in the help center.Gervais
What the heck... How can you earn 0 votes while only you provided the correct answer here? I tried every solution provided here with my curiosity and this is the perfect solution.Sejant
D
0

Previously My Chrome Freeze feature was not working by pressing f8 shortcut Key , i use this walk around and goto Source Tab and just clicked on Pause / play on Script Execution button in right panel of chrome Dev tools in Source Tab, My short cut key that got fixed and started to work from then, Really thank full , Fixed my problem

Dagenham answered 17/6, 2021 at 15:7 Comment(0)
A
0

I found another way to do this.

If your element is shown by a click on a button then hides when focus is removed, just right-click and copy the button's selector, then go to the Elements panel in dev tools and hit Esc to open the console at the same time.

Then right-click again on the button and "inspect" to reveal that part of the HTML in the document.

Go back to your console and manually trigger the click event using: document.querySelector('#yourButtonSelector').click()

Then it goes into the desired state while your focus is on DevTools, and you can click around the Elements panel without causing it to disappear. Hope this helps!

Anjaanjali answered 24/8, 2023 at 13:4 Comment(1)
Dude, you can just use $0.Sejant

© 2022 - 2024 — McMap. All rights reserved.