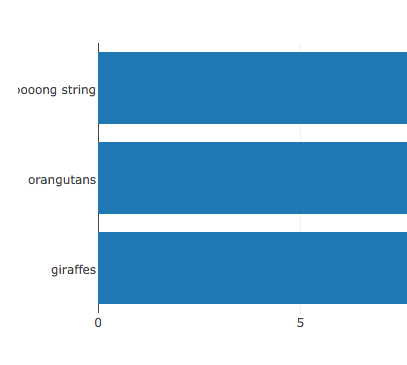
Is it possible to give more room for tick labels in plotly.js? Long labels in my charts are getting cut off.
HTML:
<div id="plot"></div>
JavaScript:
var data = [{
  type: 'bar',
  x: [20, 14, 23],
  y: ['giraffes', 'orangutans', 'a looooooooong string'],
  orientation: 'h'
}];

var layout = {
  title: 'Bar Chart'
};

Plotly.newPlot('plot', data, layout);
I can't see how to do this in the API for y-axes tick settings.
Given the nature of my charts, I need to use a horizontal orientation. So a solution I can't use is a vertical orientation with ticks rotated 90 degrees.

