I am using this algorithm to detect the pitch of this audio file. As you can hear, it is an E2 note played on a guitar with a bit of noise in the background.
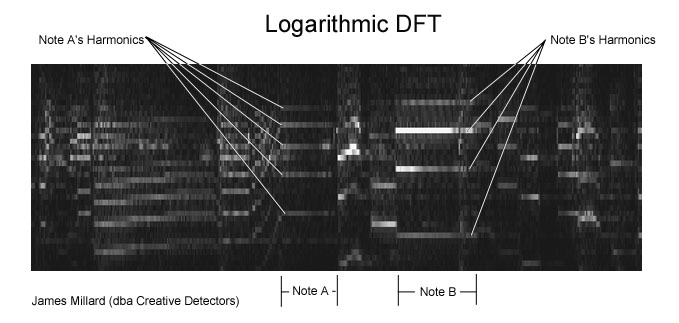
I generated this spectrogram using STFT:
And I am using the algorithm linked above like this:
y, sr = librosa.load(filename, sr=40000)
pitches, magnitudes = librosa.core.piptrack(y=y, sr=sr, fmin=75, fmax=1600)

np.set_printoptions(threshold=np.nan)
print pitches[np.nonzero(pitches)]
As a result, I am getting pretty much every possible frequency between my fmin and fmax. What do I have to do with the output of the piptrack method to discover the fundamental frequency of a time frame?
UPDATE
I am still not sure what those 2D array represents, though. Let's say I want to find out how strong is 82Hz in frame 5. I could do that using the STFT function which simply returns a 2D matrix (which was used to plot the spectrogram).
However, piptrack does something additional which could be useful and I don't really understand what. pitches[f, t] contains instantaneous frequency at bin f, time t. Does that mean that, if I want to find the maximum frequency at time frame t, I have to:
- Go to the
magnitudes[][t]array, find the bin with the maximum magnitude. - Assign the bin to a variable
f. - Find
pitches[b][t]to find the frequency that belongs to that bin?


pitchescontains the frequencies of every FFT bin betweenfminandfmax. Try checking the nonzero elements ofmagnitudes, and looking at their corresponding pitches. – Anschluss