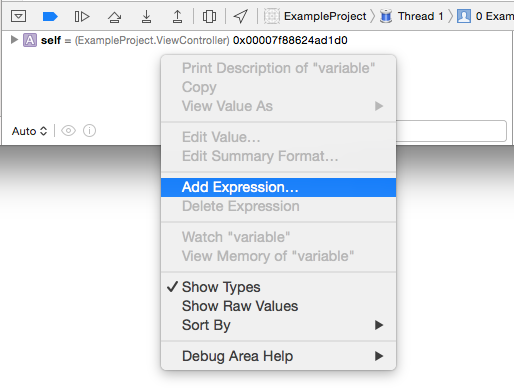
I haven't gotten watchpoints created from the Run menu to work for me either, unfortunately. One thing to be aware of is that when a variable goes out of scope, the watchpoint may become invalid.
If you don't mind getting a little more in-depth, you can use some low-level gdb commands to set a watchpoint for the address of the memory itself. For example, in the guide you linked to, they show how to watch the variable path which is a pointer with the value 0xbfffeb70. To manually set a watchpoint for that address, click in the debugger console (where the debugging output is printed) after the "(gdb)" prompt and type something like this:
watch *((int*)0xbfffeb70)
The cryptic syntax is necessary because gdb expects inputs as C expressions. For a little more detail, visit this link and jump to the section titled "Using hardware watchpoints". (I'm testing on an Intel machine, not sure how PowerPC handles it.) When you set watchpoints this way, Xcode will alert you with a drop-down sheet when a watchpoint is reached and tell you how the value was changed, and gdb will print the same info in the console.

