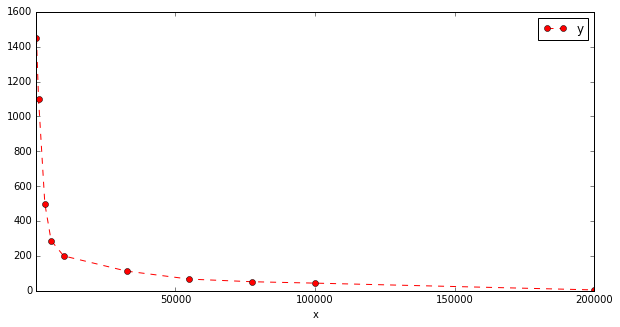
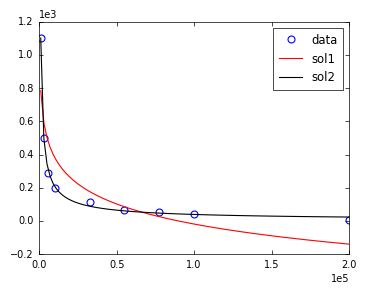
I am trying to find a curve fitting my data that visually seem to have a power law distribution.
I hoped to utilize scipy.optimize.curve_fit, but no matter what function or data normalization I try, I am getting either a RuntimeError (parameters not found or overflow) or a curve that does not fit my data even remotely. Please help me to figure out what I am doing wrong here.
%matplotlib inline
import numpy as np
import pandas as pd
import matplotlib.pyplot as plt
from scipy.optimize import curve_fit

df = pd.DataFrame({
            'x': [ 1000, 3250, 5500, 10000, 32500, 55000, 77500, 100000, 200000 ],
            'y': [ 1100, 500, 288, 200, 113, 67, 52, 44, 5 ]
        })
df.plot(x='x', y='y', kind='line', style='--ro', figsize=(10, 5))

def func_powerlaw(x, m, c, c0):
    return c0 + x**m * c

target_func = func_powerlaw

X = df['x']
y = df['y']

popt, pcov = curve_fit(target_func, X, y)

plt.figure(figsize=(10, 5))
plt.plot(X, target_func(X, *popt), '--')
plt.plot(X, y, 'ro')
plt.legend()
plt.show()
Output
---------------------------------------------------------------------------
RuntimeError                              Traceback (most recent call last)
<ipython-input-243-17421b6b0c14> in <module>()
     18 y = df['y']
     19
---> 20 popt, pcov = curve_fit(target_func, X, y)
     21
     22 plt.figure(figsize=(10, 5))

/Users/evgenyp/.virtualenvs/kindle-dev/lib/python2.7/site-packages/scipy/optimize/minpack.pyc in curve_fit(f, xdata, ydata, p0, sigma, absolute_sigma, check_finite, bounds, method, **kwargs)
    653         cost = np.sum(infodict['fvec'] ** 2)
    654         if ier not in [1, 2, 3, 4]:
--> 655             raise RuntimeError("Optimal parameters not found: " + errmsg)
    656     else:
    657         res = least_squares(func, p0, args=args, bounds=bounds, method=method,

RuntimeError: Optimal parameters not found: Number of calls to function has reached maxfev = 800.


