I'm trying to understand and plot TPR/FPR for different types of classifiers. I'm using kNN, NaiveBayes and Decision Trees in R. With kNN I'm doing the following:
clnum <- as.vector(diabetes.trainingLabels[,1], mode = "numeric")
dpknn <- knn(train = diabetes.training, test = diabetes.testing, cl = clnum, k=11, prob = TRUE)
prob <- attr(dpknn, "prob")
tstnum <- as.vector(diabetes.testingLabels[,1], mode = "numeric")
pred_knn <- prediction(prob, tstnum)
pred_knn <- performance(pred_knn, "tpr", "fpr")
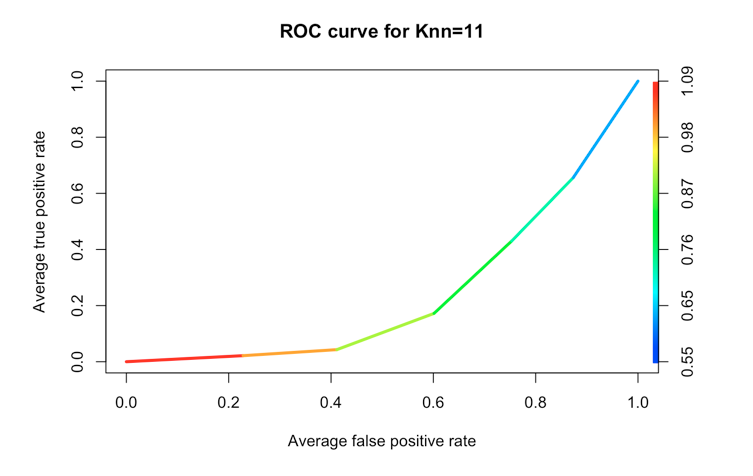
plot(pred_knn, avg= "threshold", colorize=TRUE, lwd=3, main="ROC curve for Knn=11")
where diabetes.trainingLabels[,1] is a vector of labels (class) I want to predict, diabetes.training is the training data and diabetes.testing is the testing data.
Plot looks like the following:

The values stored in prob attribute is a numeric vector (decimal between 0 and 1). I convert the class labels factor into numbers and then I can use it with prediction/performance function from ROCR library. Not 100% sure I'm doing it correct but at least it works.
For the NaiveBayes and Decision Trees tho, with prob/raw parameter specified in predict function I don't get a single numeric vector but a vector of lists or matrix where probability for each class is specified (I guess), eg:
diabetes.model <- naiveBayes(class ~ ., data = diabetesTrainset)
diabetes.predicted <- predict(diabetes.model, diabetesTestset, type="raw")
and diabetes.predicted is:
tested_negative tested_positive
[1,]    5.787252e-03       0.9942127
[2,]    8.433584e-01       0.1566416
[3,]    7.880800e-09       1.0000000
[4,]    7.568920e-01       0.2431080
[5,]    4.663958e-01       0.5336042
The question is how to use it to plot ROC curve and why in kNN I get one vector and for other classifiers I get them separate for both classes?

