I understand that scale changes both parameters at the same time, but I want to achieve the effect of having a thin line connected between big markers.
I also tried resizing through rc{'lines.linewidth' = 1, 'lines.markersize' = 5}, but it ends up scaling both the markersize and linewidth together instead of setting them independently. Essentially, markersize has no effect for some reason.
Edit: Added plot and code to show the problem
import seaborn as sns

sns.set(style="whitegrid")
paper_rc = {'lines.linewidth': 1, 'lines.markersize': 10}
sns.set_context("paper", rc = paper_rc)

# Load the example exercise dataset
df = sns.load_dataset("exercise")

# Draw a pointplot to show pulse as a function of three categorical         factors
g = sns.factorplot(x="time", y="pulse", hue="kind", col="diet", data=df,
                       palette="YlGnBu_d", size=6, aspect=.75)
g.despine(left=True)
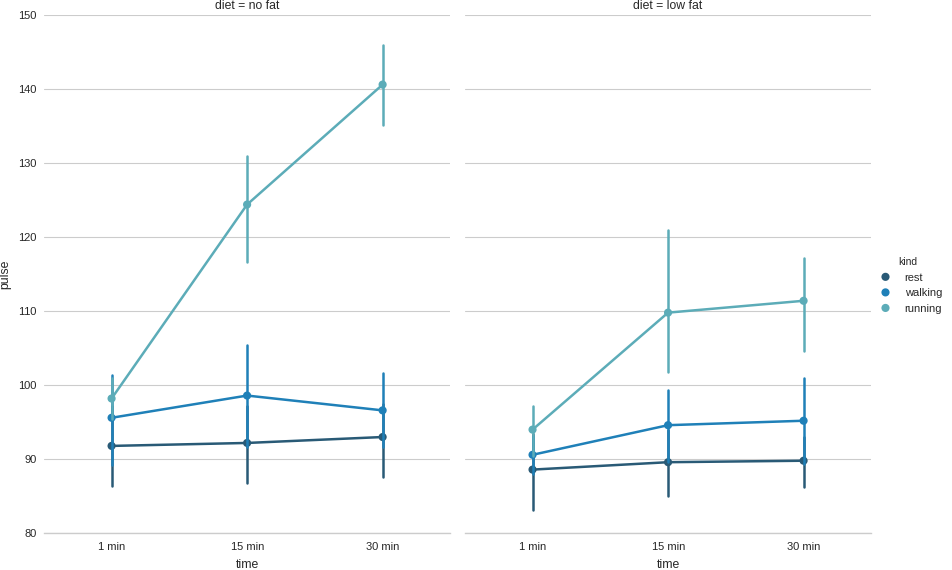
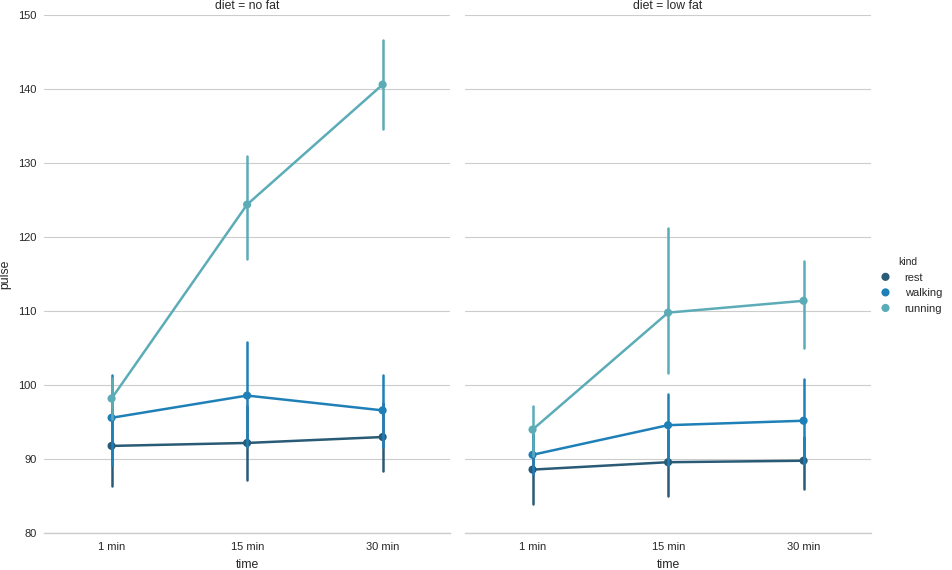
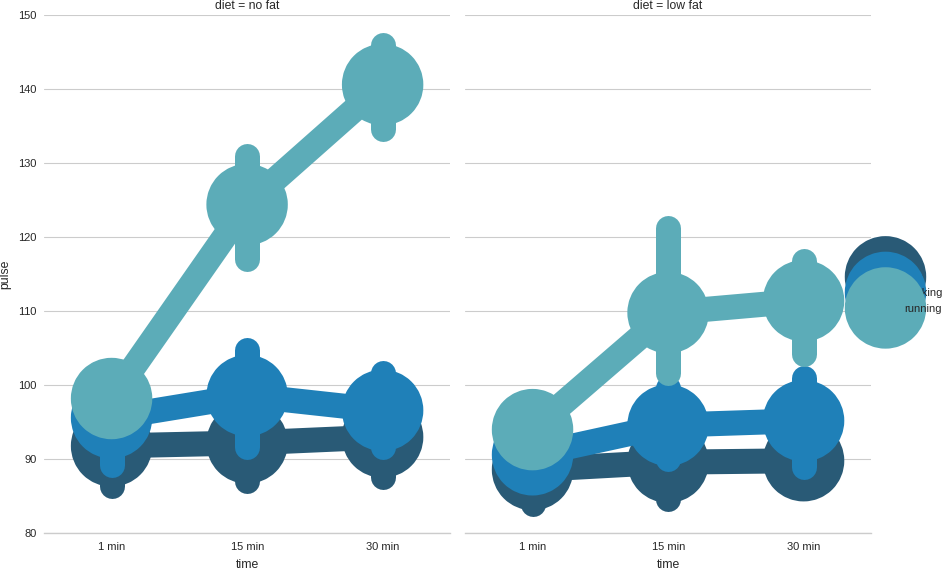
The first two figures below are created with markersize 1 and 10, respectively. As shown, they appear to have the same markersize. The last figure uses line.linewidth=10 line.markersize=1, which enlarges both the linewidth and markersize.


