Show color thresholds in c3.js gauge
Asked Answered
K

1

20

I'm trying to configure a gauge chart but I would like to show the threshold values in the chart (outside labels with the color would be nice) just to realize how far the value is from the next level.

Any one can help me?

This is the gauge now:

Gauge Now

This is what I expect:

Wished gauge

Kiyokokiyoshi answered 12/5, 2015 at 6:18 Comment(1)
Hard to know what you're wanting from that question. Could you rephrase/elaborate?Pauper
D
7

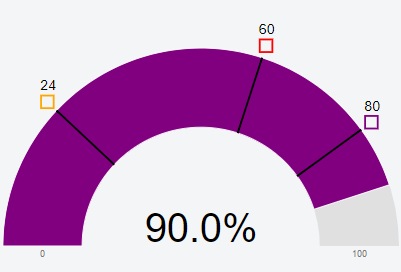
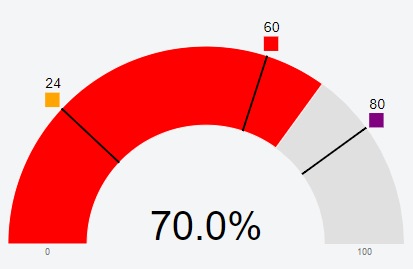
There is no specific option in c3.js Gauge chart to draw thresholds lines and legends, so I thought to use d3.js to add them to chart on rendered event:

onrendered: function() {
    drawThresholds(this, thresholdOpts, opts);
}

Check this jsfiddle for complete example: https://jsfiddle.net/beaver71/032tcczg/

Output obtained looks like below:

enter image description here

and:

enter image description here

Dunlin answered 16/1, 2018 at 9:15 Comment(1)
@Martina, Is this proposal suitable for you?Dunlin

© 2022 - 2024 — McMap. All rights reserved.