How to plot a rotating 3D earth
Asked Answered
C

3

20

I know we can create simple 3-Dimensional spheres using matplotlib, an example of such a sphere is included in the documentation.

Now, we also have a warp method as part of the matplotlib module, an example of it's usage is here .

To warp a cylindrical image to the sphere. Is it possible to combine these methods to create a 3D rotatable earth? Unless my way of thinking about this problem is way off it seems that to be able to do this you would have to take the pixel data of the image and then plot every pixel using the sin and cosine expressions along the surface of the 3D sphere being created in the first example. Some examples of these cylindrical maps can be found here

I know alternative ways to do this are through maya and blender, but I am attempting to stay within matplotlib to do this, as I want to create this plot and then be able to plot geospatial data to the surface using an array of data.

Caerleon answered 15/5, 2015 at 21:35 Comment(0)
J
12

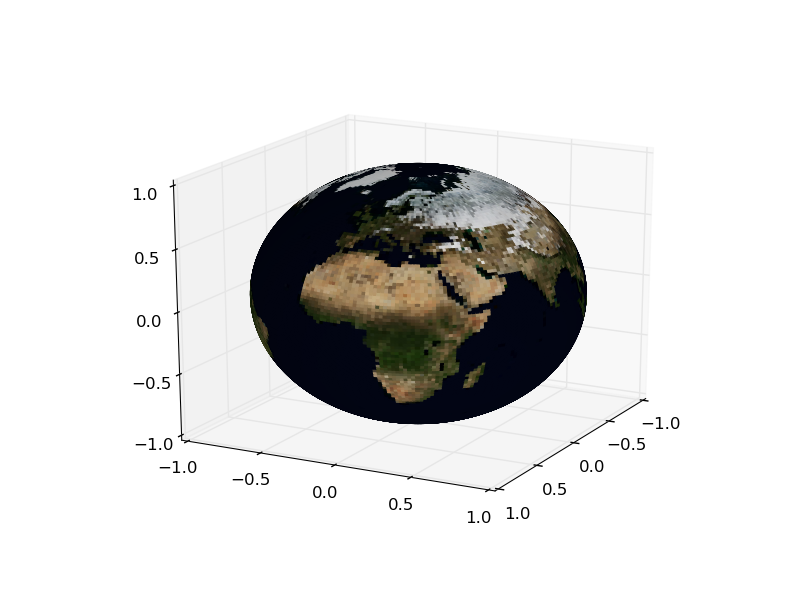
Interesting question. I tried to basically follow the thinking outlined by @Skeletor, and map the image so that it can be shown with plot_surface:

import PIL
import matplotlib.pyplot as plt
import numpy as np
from mpl_toolkits.mplot3d import Axes3D

# load bluemarble with PIL
bm = PIL.Image.open('bluemarble.jpg')
# it's big, so I'll rescale it, convert to array, and divide by 256 to get RGB values that matplotlib accept 
bm = np.array(bm.resize([d/5 for d in bm.size]))/256.

# coordinates of the image - don't know if this is entirely accurate, but probably close
lons = np.linspace(-180, 180, bm.shape[1]) * np.pi/180 
lats = np.linspace(-90, 90, bm.shape[0])[::-1] * np.pi/180 

# repeat code from one of the examples linked to in the question, except for specifying facecolors:
fig = plt.figure()
ax = fig.add_subplot(111, projection='3d')

x = np.outer(np.cos(lons), np.cos(lats)).T
y = np.outer(np.sin(lons), np.cos(lats)).T
z = np.outer(np.ones(np.size(lons)), np.sin(lats)).T
ax.plot_surface(x, y, z, rstride=4, cstride=4, facecolors = bm)

plt.show()

Result: bluemarble.jpg shown in 3D with plot_surface

Jacintojack answered 4/4, 2016 at 12:47 Comment(1)
I would suggest setting equal aspect ratio axes here too so this looks like a sphere. ax.set_aspect('equal')Jezreel
K
3

Here what I made some hours ago:

First we import the needed libraries:

from mpl_toolkits.basemap import Basemap
import matplotlib.pyplot as plt
import imageio

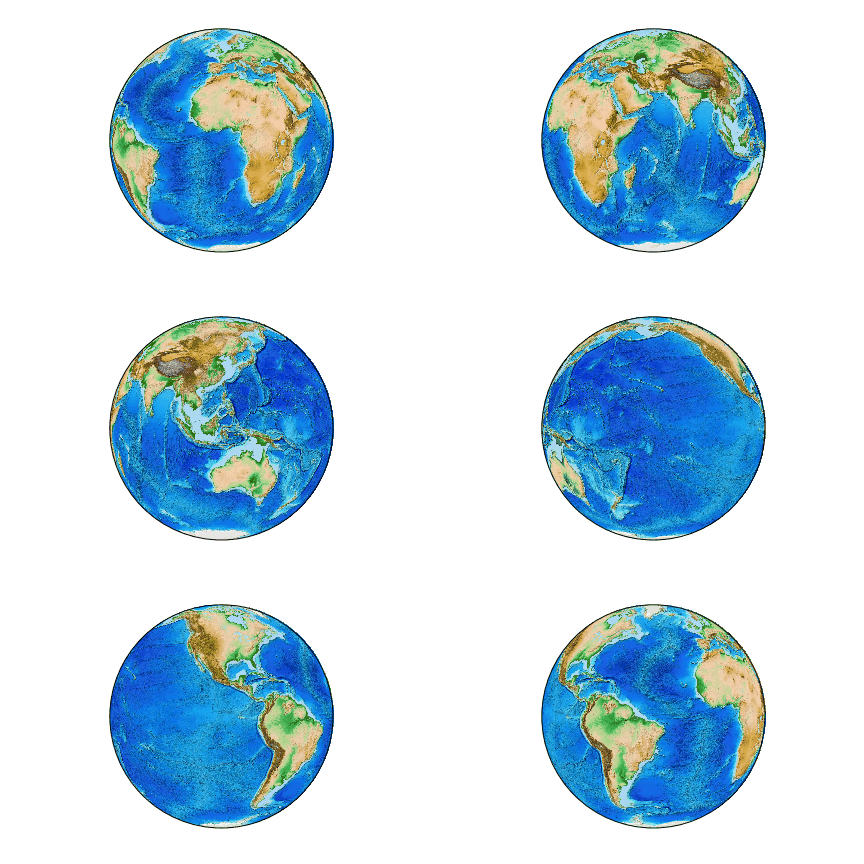
Secondly, we make the figures and stored them as png in our directory: Note that I wrote range(0,330,20)

 for i in range(0,330,20):
    my_map = Basemap(projection='ortho', lat_0=0, lon_0=i, resolution='l', area_thresh=1000.0)
    my_map.bluemarble()
    my_map.etopo()
    name=str(i)
    path='/path/to/your/directory/'+name
    plt.savefig(path+'.png')
    plt.show()
    plt.clf()
    plt.cla()
    plt.close()

And finally we can join all the images in an animated GIF:

images = []
for f in range(0,330,20):
    images.append(imageio.imread("/path/to/your/directory/"+str(f)+".png"))
    imageio.mimsave('movie.gif', images, duration=0.5)

and then enjoy the result: enter image description here

Klemens answered 24/2, 2017 at 22:48 Comment(0)
B
0

I could imagine the following solution: Using numpy.roll you could shift your array by one column (ore more) with each call. So you could load your image of the earth surface into a numpy array as a template and export the rotated image into a jpg. This you plot as shown in the warp example.

Bosch answered 3/4, 2016 at 7:7 Comment(0)

© 2022 - 2024 — McMap. All rights reserved.